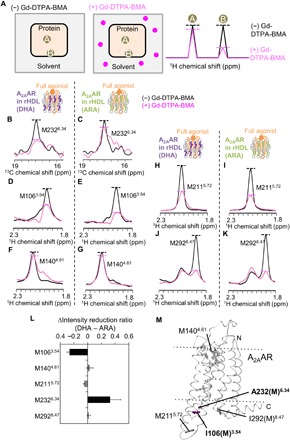
Fig. 5. Conformations of A2AAR in rHDL(DHA) and A2AAR in rHDL(ARA) examined by solvent PRE experiments.

(A) Schematic diagrams of the solvent PRE experiments. (B to K) Overlaid cross sections of the resonances from M2326.34, M1063.54, M1404.61, M2115.72, and M2928.47 in the 1H-13C HMQC spectra of A2AAR in rHDL(DHA) and A2AAR in rHDL(ARA), without Gd-DTPA-BMA (black) and with 5 mM Gd-DTPA-BMA (magenta). (L) Plots of the differences between the intensity reduction ratios observed for A2AAR in rHDL(DHA) and those observed for A2AAR in rHDL(ARA). The error bars represent the experimental errors, calculated from the root sum squares of the (noise level/signal intensity) in the four spectra, with and without Gd-DTPA-BMA in the experiments using A2AAR in rHDL(DHA) and A2AAR in rHDL(ARA). (M) Distribution of the methionine residues in the crystal structure of A2AAR. The crystal structure of A2AAR with a full agonist, NECA (PDB code: 2YDV), is shown in ribbons in a side view, with the extracellular sides on the top. I106(M)3.54 and A232(M)6.34, which exhibited different solvent accessibilities between A2AAR in rHDL(DHA) and A2AAR in rHDL(ARA), are depicted by purple sticks. M1404.61, M2115.72, and I292(M)8.47, in which the solvent accessibilities of A2AAR in rHDL(DHA) were almost identical to those of A2AAR in rHDL(ARA), are depicted by dark gray sticks. M1745.37, M1775.40, M1935.54, and M2707.34, with resonances that were not observed in the presence of the full agonist, are depicted by gray sticks. NECA is depicted by gray sticks. The membrane position generated by the OPM database (http://opm.phar.umich.edu/) is indicated.
