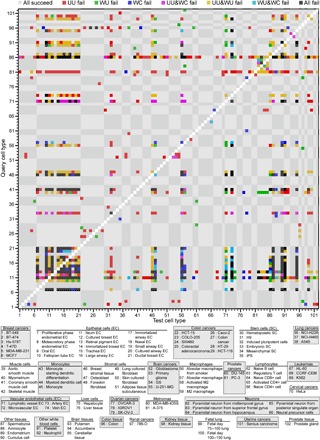
Fig. 3. Distinguishing cell types by the cell type homogeneity criterion for the GeneExp dataset.

Equation 5 quantifies cell type homogeneity according to the UU, WU, and WC versions of measuring distance. The gray and white checkered background corresponds to the cell type groupings enumerated in table S2, and tick labels indicate the cell type associated with each row and column based on the key below the figure. The color coding defined in the legend above the figure marks the cases in which one or more of the versions failed for each query (row) and test (column) cell type. Gray indicates that the identification was successful for all three versions (91.4% of all cases). Self-comparisons (white diagonal) were not evaluated.
