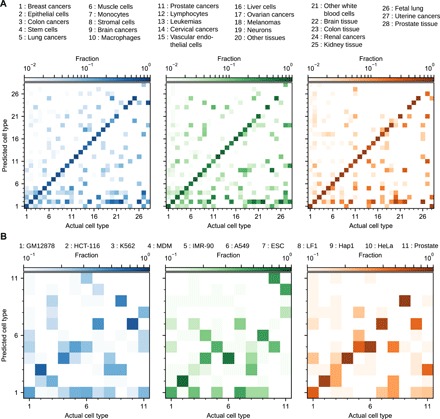
Fig. 5. Comparison of LOGO validation for the three versions of the KNN technique applied to the GeneExp and Hi-C datasets.

(A) Validation for the GeneExp dataset using 4 features. The colors indicate the version of the method used to classify the cell types (blue for UU, green for WU, and orange for WC), while the opacity indicates fraction of the total number of experiments belonging to the x axis cell type that are predicted to belong to the y axis cell type. (B) Same as (A), but for the Hi-C dataset using 3 features.
