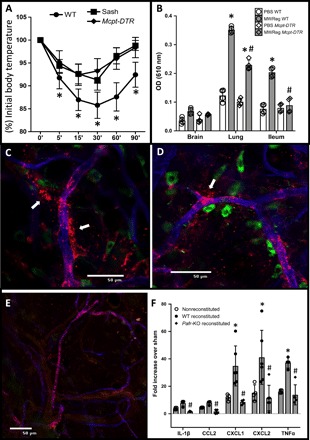
Fig. 5. MCs propagate tissue responses after platelet activation.

(A) Temperature measurement following intravenous administration of MWReg30 in WT mice and in MC-deficient KitW-sh/W-sh (Sash) or MC-depleted Mcpt5-cre + iDTR + (Mcpt-DTR) mice. n = 6 per condition. *P < 0.05 versus MWReg30-treated WT, two-way ANOVA. (B) Extravasation of Evans blue after intravenous administration of MWReg30 in control or MC-depleted Mcpt-DTR mice. OD, optical density. n = 5 per condition. *P < 0.05 versus unchallenged WT; #P < 0.05 versus MWReg30-treated WT, one-way ANOVA and Tukey’s multiple comparisons test. Immunofluorescence in whole-mount tissue (ear) in animals administered 150 kDa of TRITC-dextran intravenously before MWReg30 administration [blue, endothelium (anti-CD31); green, MCs (fluorescein isothiocyanate–avidin)] shows tracer extravasation (arrows) in WT mice (C and D) but not in Sash mice (E). (F) Transcriptional analysis of small intestinal tissue expression of inflammatory markers in Sash mice or in Sash mice reconstituted with Pafr-KO (Pafr-KO reconstituted) or WT (WT reconstituted) bone marrow–derived MCs and treated with MWReg30. Data are represented as the means ± SD. n = 4 to 6 per condition. *P < 0.05 versus nonreconstituted and #P < 0.05 versus WT-reconstituted animals. One-way ANOVA and Tukey’s multiple comparisons test.
