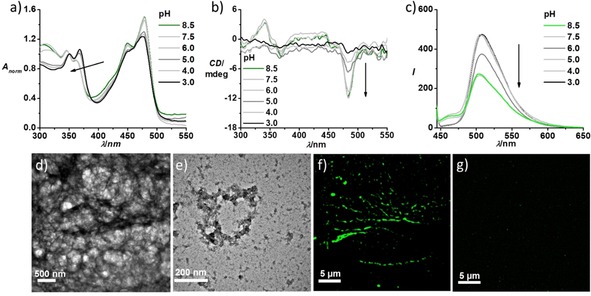
Figure 2.

pH‐dependent a) absorption, b) CD and c) emission spectra (λex=430 nm) of NDI‐diOEt‐cat, which shows a change in the ratio between π‐π* vibronic bands, appearance of CD signal and quenching of emission (λex=430 nm) on increasing the pH of the solution. These spectral features refer to the self‐assembled structures at pH 8.5 and monomeric or molecular dissolved species at pH 3 due to charge repulsion between lysine moieties. TEM images of NDI‐diOEt‐cat at d) pH 8 (10 mM Tris HCl buffer) and at e) pH 3 (0.15 M citric acid buffer, 9 : 1 Ca/Na3C) show the presence of 1D supramolecular polymers and absence of elongated self‐assembled structures, respectively. TEM samples were prepared by placing a drop of the solution on carbon coated copper grids followed by drying at room temperature in a desiccator; samples were stained with uranyl acetate. SIM microscopy images (λex=488 nm) depict f) long fibre‐like green fluorescent supramolecular polymers at pH 8 and g) absence of any fluorescent self‐assembled structures at pH 3 ([NDI‐diOEt‐cat]=5×10⁻⁵ M, l=10 mm).
