Figure 5.

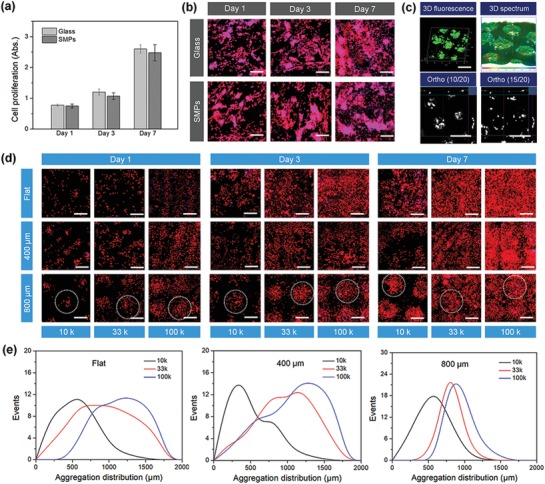
Biocompatibility of the synthesized polymeric materials and NSC aggregation behavior. a) NSC proliferation on SMP and glass samples after 1, 3, and 7 days of culture. There is no significant difference among these samples (N.S.), suggesting our SMPs exhibited an excellent cytocompatibility in vitro. b) NSC morphology on SMP and glass samples after 1, 3, and 7 days of culture, where F‐actin is colored red and the nucleus is colored blue. Scale bar is 200 µm. c) 3D fluorescent images and image analysis of GFP‐NSCs when cells were seeded in the 4D microwell arrays. The 3D spectrum showed the fluorescent intensity distribution of aggregates when NSC grew in the microwell arrays. The ortho (10/20) and (15/20) images demonstrated the aggregation morphology of NSCs at the different Z position of the microwell arrays. The scale bar is 1 mm. d) Fluorescent images of NSCs with different cell densities on different culture substrates (flat, 400 µm, and 800 µm microwells) after 1, 3, and 7 days of culture. Dotted circles indicate the NSC aggregation in the microwell region. The scale bar is 600 µm. e) Quantitative analysis of NSC size distribution by fluorescence aggregation at 3 days.
