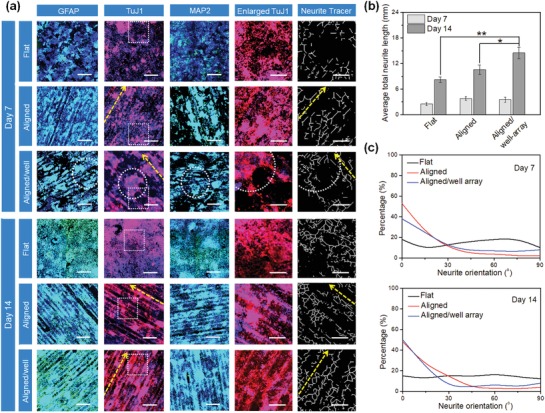
Figure 7.

NSC differentiation studies on 4D aligned/microwell arrays on SMPs. a) Immunofluorescent images of NSC differentiation on 4D Aligned/microwell arrays compared to flat samples and samples with alignment only, after culturing in differentiation medium for 2 weeks. GFAP and MAP2 are colored green, TuJ1 is colored red, and nuclei are colored blue. The scale bar is 500 µm. The dotted squares in TuJ1 images indicate the enlarged area, which is used to generate the images of neurite tracer (scale bar is 200 µm). The dotted circles indicate the NSC aggregation in microwell. The yellow dotted arrows show the direction of aligned patterns (microgrooves). b) Quantification of total neurite length of neural differentiation 4D aligned/microwell arrays when compared to other corresponding groups at 7 days and 14 days. Data are mean ± standard deviation; n = 9; *p < 0.05. c) The neurite direction of the microgrooves was set as an angle of 0° (horizontal direction was set as 0° for the flat control samples). The neurite major axis with respect to the direction of the microgrooves (or horizontal direction for flat control) was defined as the neurite orientation. The neurites were considered to be aligned if their angles fell into ±20° from the original benchmark.
