
Figure 2.
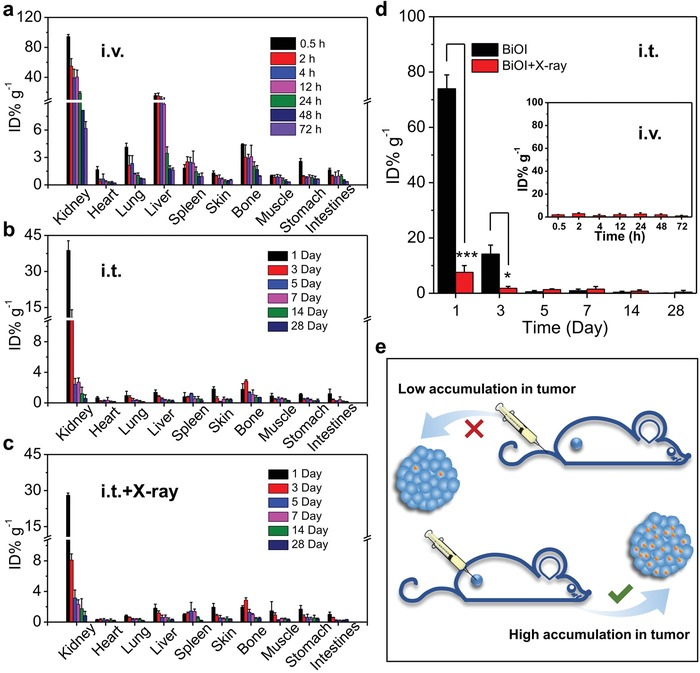
Biodistribution study of BiOI QDs via different administration methods. a) Time‐dependent biodistribution of Bi after intravenous injection (i.v.) of BiOI QDs (500 µg mL−1, 200 µL). b) Bi distribution in main organs after intratumoral injection (i.t.) of BiOI QDs (2 mg mL−1, 50 µL) without and c) with X‐ray irradiation (6 Gy). d) Biodistribution of Bi in the tumor site via different injection methods. e) Schematic illustration showing the influence of injection method on the distribution of BiOI QDs in tumor site. p Values were calculated by the Student's t test: *p < 0.05, ***p < 0.001.