
Figure 5.
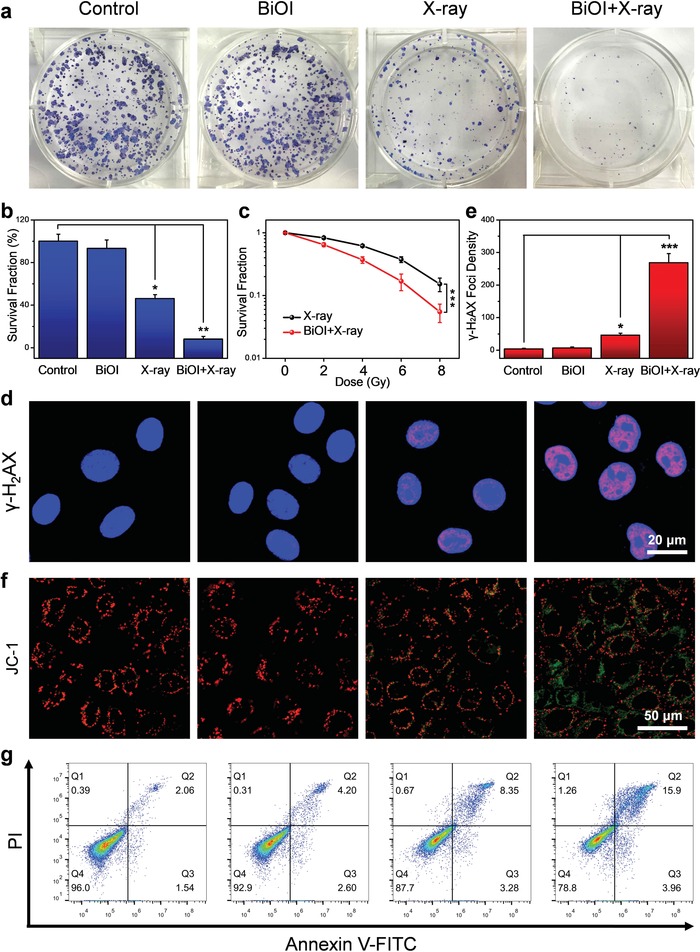
Enhanced RT of BiOI QDs in vitro. a) Colony formation of 4T1 cells treated with BiOI QDs (50 µg mL−1) and X‐ray irradiation (6 Gy). b) Survival fraction from colony assay in each group. c) Dose‐effect curve from colony assay in 4T1 cells under X‐ray with or without BiOI QDs. d) Confocal images of DNA damage in 4T1 cells treated with BiOI QDs (50 µg mL−1) and X‐ray irradiation (6 Gy). e) Normalized fluorescence spot number of γ‐H2AX staining 4T1 cells after various treatments. f) JC‐1 staining in 4T1 cells to detect the change in mitochondrial membrane potential. g) Apoptosis/necrosis detection of 4T1 cells via flow cytometry analysis. p Values were calculated by the Student's t test: *p < 0.05, **p < 0.01, ***p < 0.001.