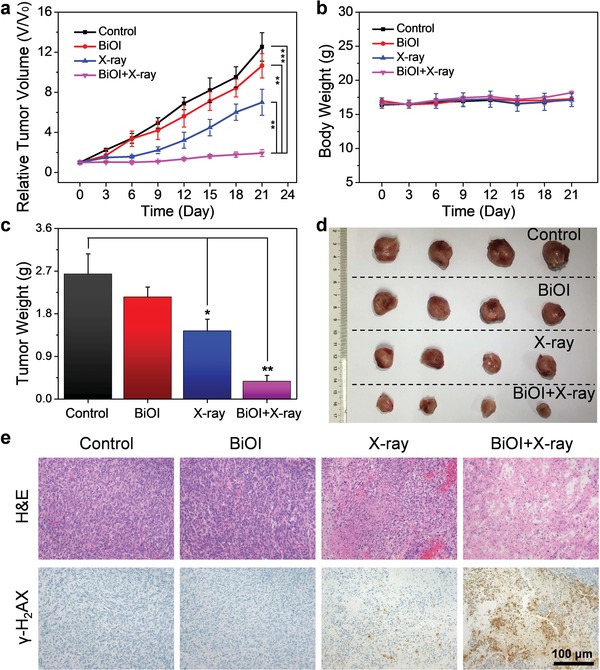
Figure 6.

BiOI QDs sensitized RT in vivo. a) Relative tumor volume profile of different groups: Control, BiOI, X‐ray, BiOI + X‐ray. b) Body weights of 4T1‐tumor‐bearing mice after treatments. c) Weights of excised tumors of each group at 21st day after treatments. d) Photograph of excised tumors in each group at 21st day after treatments. e) Tumor images with H&E and γ‐H2AX staining after treatments. p Values were calculated by the Student's t test: *p < 0.05, **p < 0.01, ***p < 0.001.
