
Figure 2.
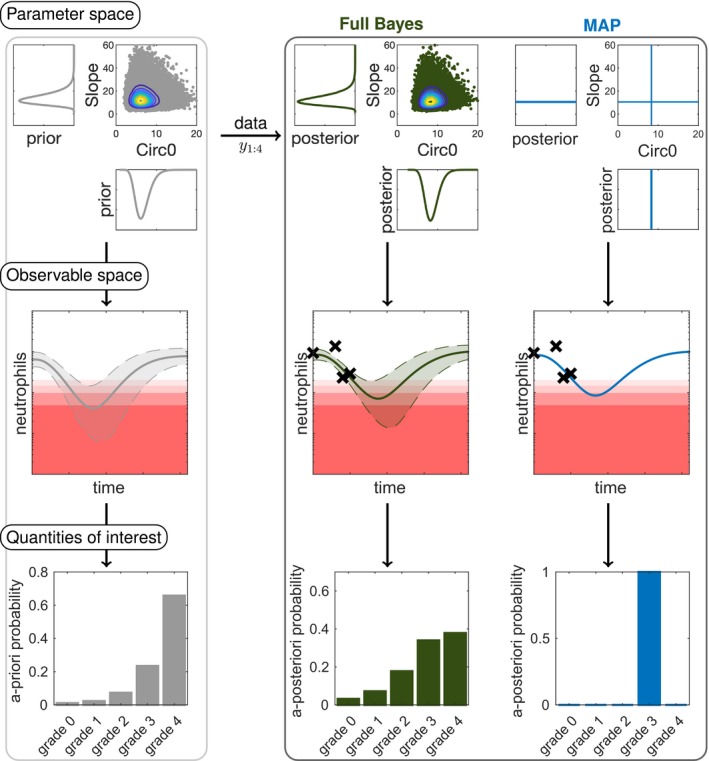
Overview of the workflow in model‐informed precision dosing comparing full Bayesian inference to maximum a posteriori (MAP)‐based prediction. In full Bayesian inference, uncertainties in the parameter values are propagated to uncertainties in the observable space and quantities of interest. The posterior is displayed for the parameters “Slope” (drug effect parameter) and “Circ0” (pretreatment neutrophil concentration). For the prior and full Bayes (reference) approach (sampling importance resampling with ) samples (dots) from the distributions are shown with contour levels. In the observable space, the point estimates (solid lines) are displayed with the central 90% confidence interval or credible intervals (dashed lines and shaded area) along with the therapeutic drug/biomarker monitoring data (crosses). The a priori/a posteriori probabilities are calculated for the neutropenia grades (grade 0–4). Note that corresponds to the measurement of baseline neutrophil counts (“Circ0”) and is taken into account in the posterior.