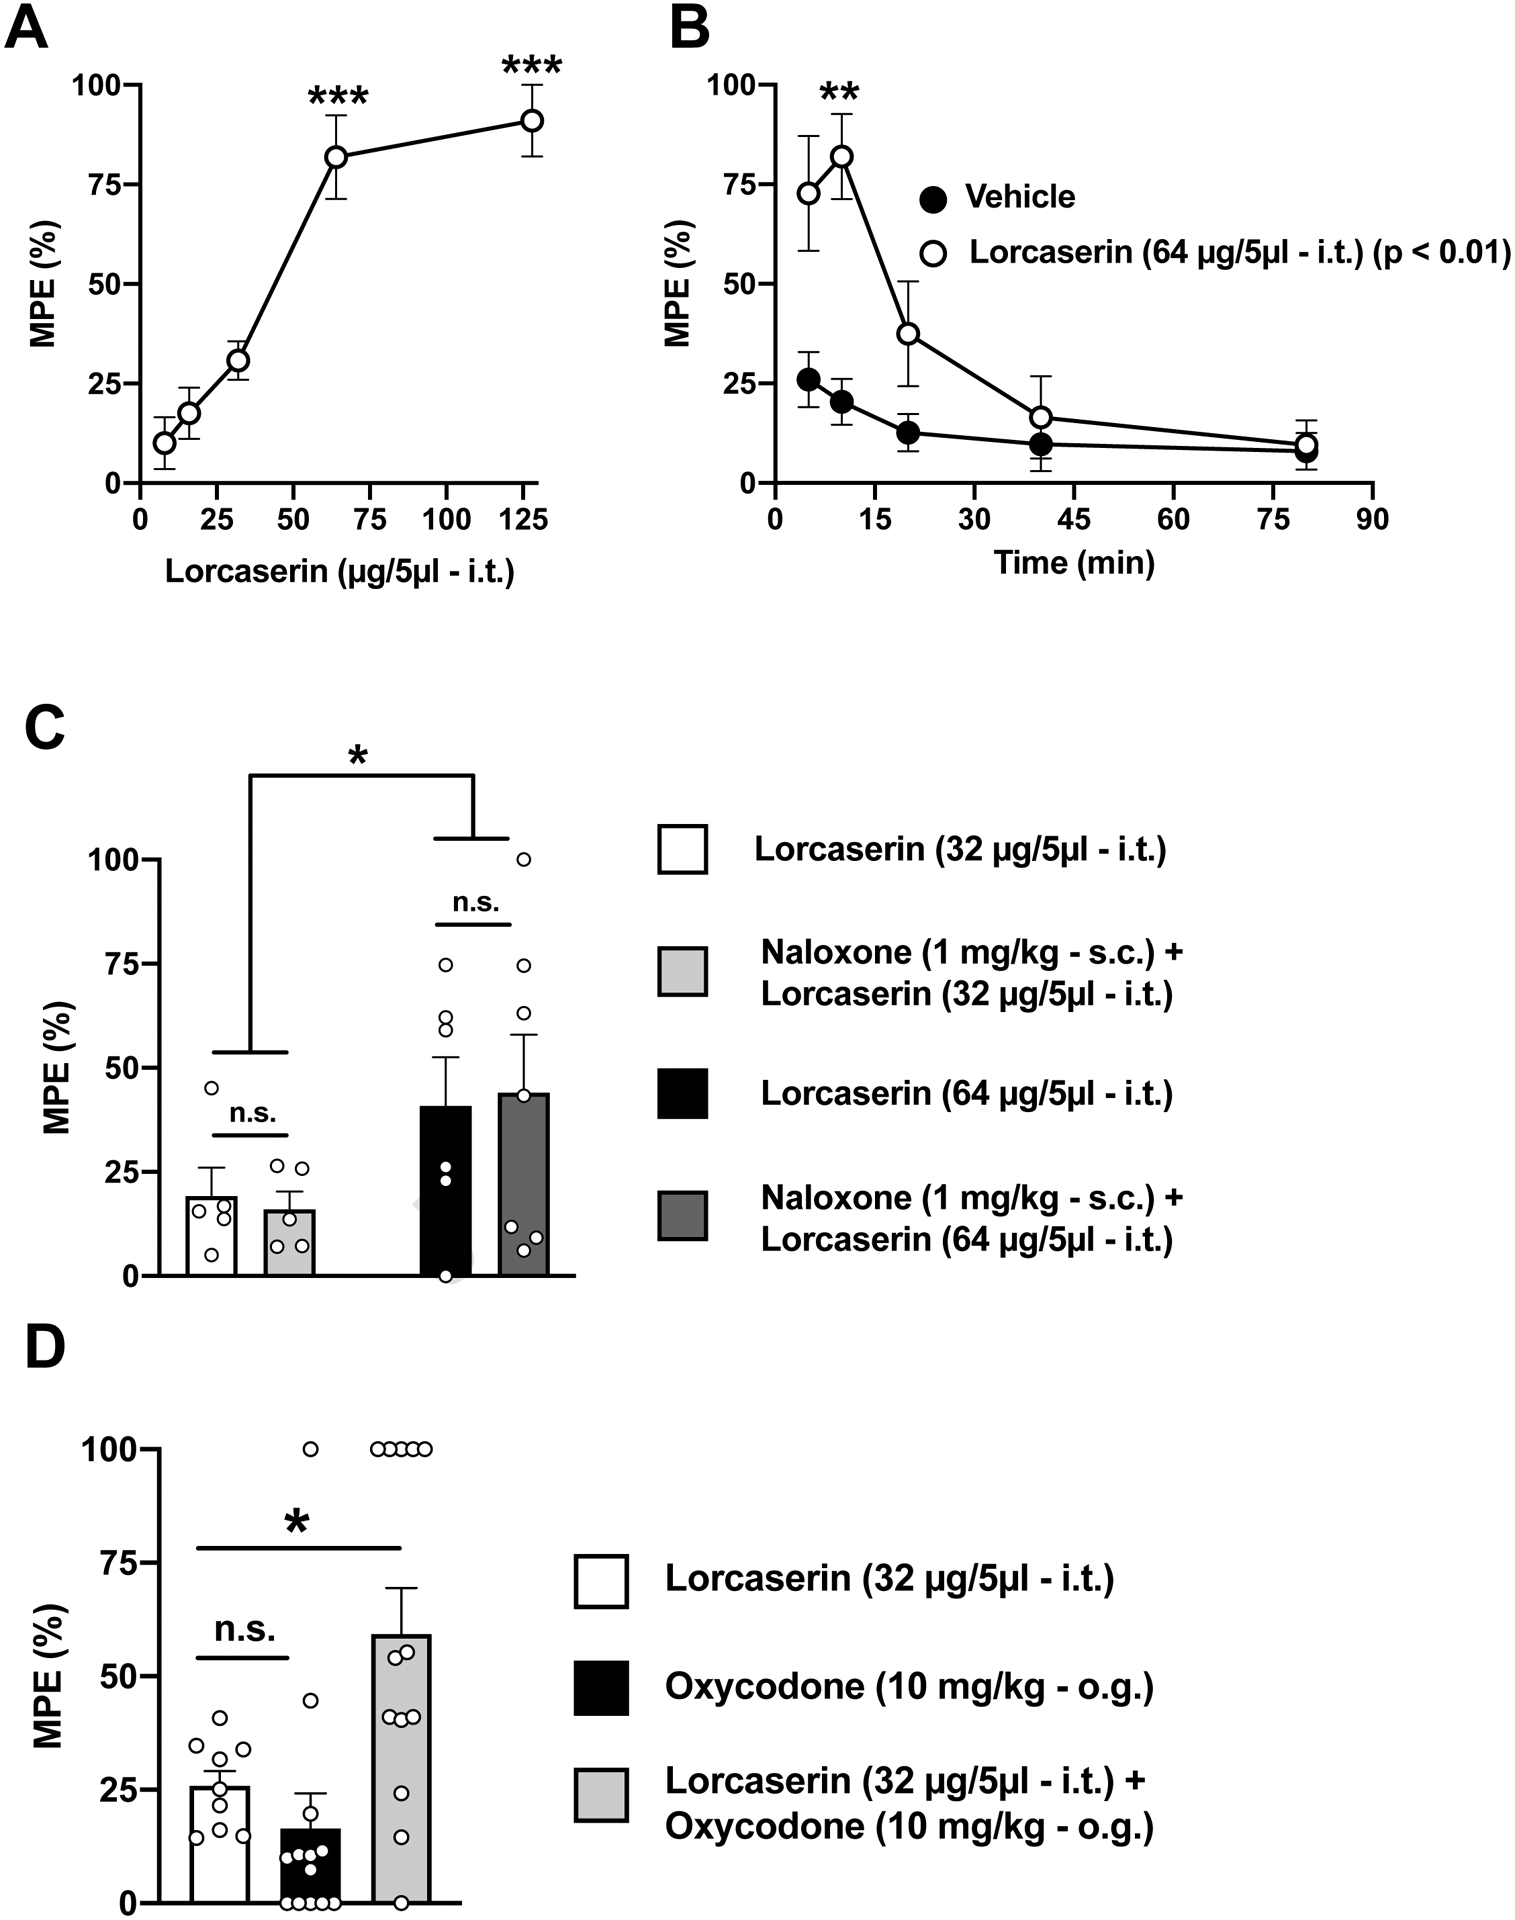
Fig. 1. Effect of lorcaserin (i.t.) on response latencies over time on the TFR test.

(A) Dose-dependent antinociceptive effect of lorcaserin (i.t.) in the TFR test (n = 5–8). Data were evaluated with a one-way ANOVA (F[4,21] = 24.98, p < 0.001) followed by Dunnet’s post hoc test. Asterisks in the graph show post hoc p values comparing different doses against the lowest dose. (B) Time-course of the effect of lorcaserin (i.t.) on the TFR test with peak effects at ~10 min (n = 6–7). Data were evaluated with a two-way repeated measures ANOVA (vehicle/lorcaserin × time) followed by Dunnet’s post hoc test. Lorcaserin, F[1,10] = 12.23, p < 0.01; time, F[1.4,14.02] = 13, p < 0.01; interaction of lorcaserin and time, F[4,40] = 5.42, p < 0.01. Asterisks in the graph show post hoc p values comparing vehicle versus lorcaserin at different time points. (C) Lack of effect of naloxone (s.c.) on lorcaserin (i.t.)-induced antinociception in the TFR test (n = 5–7). Data were evaluated with a two-way ANOVA (dose of lorcaserin, F[1,19] = 4.86, p < 0.05; naloxone, F[1,19] = 8.52 × 10⁻¹¹, p > 0.05; interaction of lorcaserin and naloxone, F[1,19] = 0.08, p > 0.05). (D) A subthreshold dose (32 μg) of lorcaserin (i.t.) augments oxycodone (o.g)-induced antinociception (n = 9–13). Data were evaluated with a one-way ANOVA (F[2,32] = 7.84, p < 0.01) followed by Dunnet’s post hoc test. *p<0.05, **p<0.01 ***p<0.001. n.s., not significant. Data are mean ± S.E.M response latencies expressed as percentage of MPE for the different experimental conditions.
