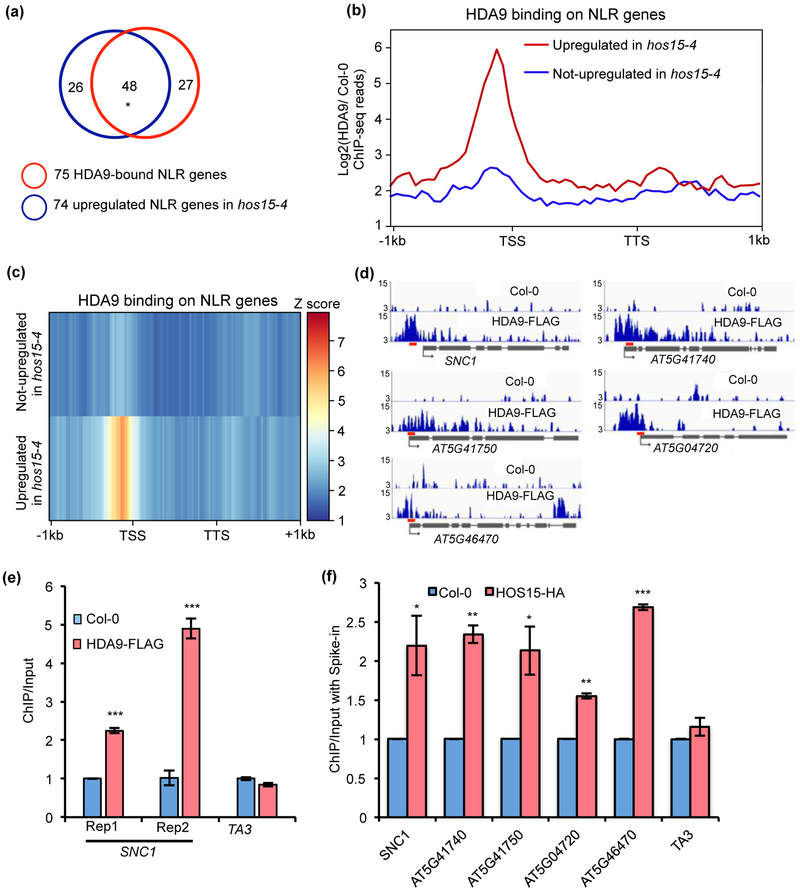
Fig. 5. HOS15 and HDA9 are associated with some NLR genes in Arabidopsis.
(a) Overlap of 75 HDA9-bound NLR genes and 74 upregulated NLR genes in hos15-4 mutant. * indicates significant difference. P < 2.457e-103 was calculated by Fisher’s exact test. (b, c) Metaplots (b) and heatmaps (c) showing HDA9 enrichment on NLR genes upregulated and not upregulated in hos15-4 mutant. Log2 value of HDA9 ChIP-seq signal normalized to wild type control was calculated for each gene, and then averaged within gene group respectively. The averaged value was used for drawing metaplots and heatmaps. TSS and TTS represent transcription start site and transcription termination site, respectively. −1kb and +1kb represent 1kb upstream of TSS and 1kb downstream of TTS, respectively. The color bar on the right of heatmaps indicates the Z-score. Y-axis of metaplots represents HDA9 ChIP-seq read density. (d) Snapshots of IGV views of HDA9 binding on NLR genes. Red bars represent the positions of primers used in Fig. 5f. (e) ChIP-qPCR showing HDA9 binding on SNC1 promoter. Rep1 and Rep2 represent two biological replicates. ChIP was normalized to Input and then normalized to Col-0. TA3 served as negative control. Error bars represent S.D. from three technical replicates. (f) ChIP-qPCR shows that HOS15-HA protein is enriched at NLR genes upregulated in hos15-4 mutant. After normalized to respective spike-in, ChIP was normalized to Input. Error bars represent S.D. from two biological replicates. * P < 0.05, **P < 0.01, ***P < 0.001.

