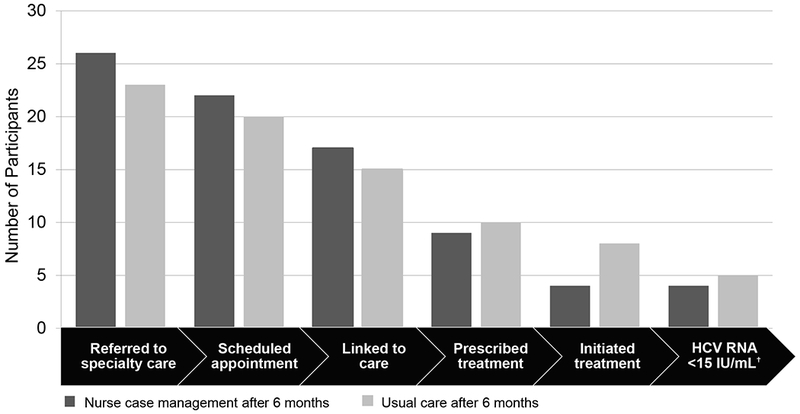
Figure 3:

Six-month HCV Care Continuum. This graph shows the hepatitis C virus (HCV) care continuum outcomes for each randomization arm at 6 months. Note: †3 participants in the usual care arm were still taking directacting antivirals at study completion secondary outcome of time to treatment initiation.
