Figure 5.

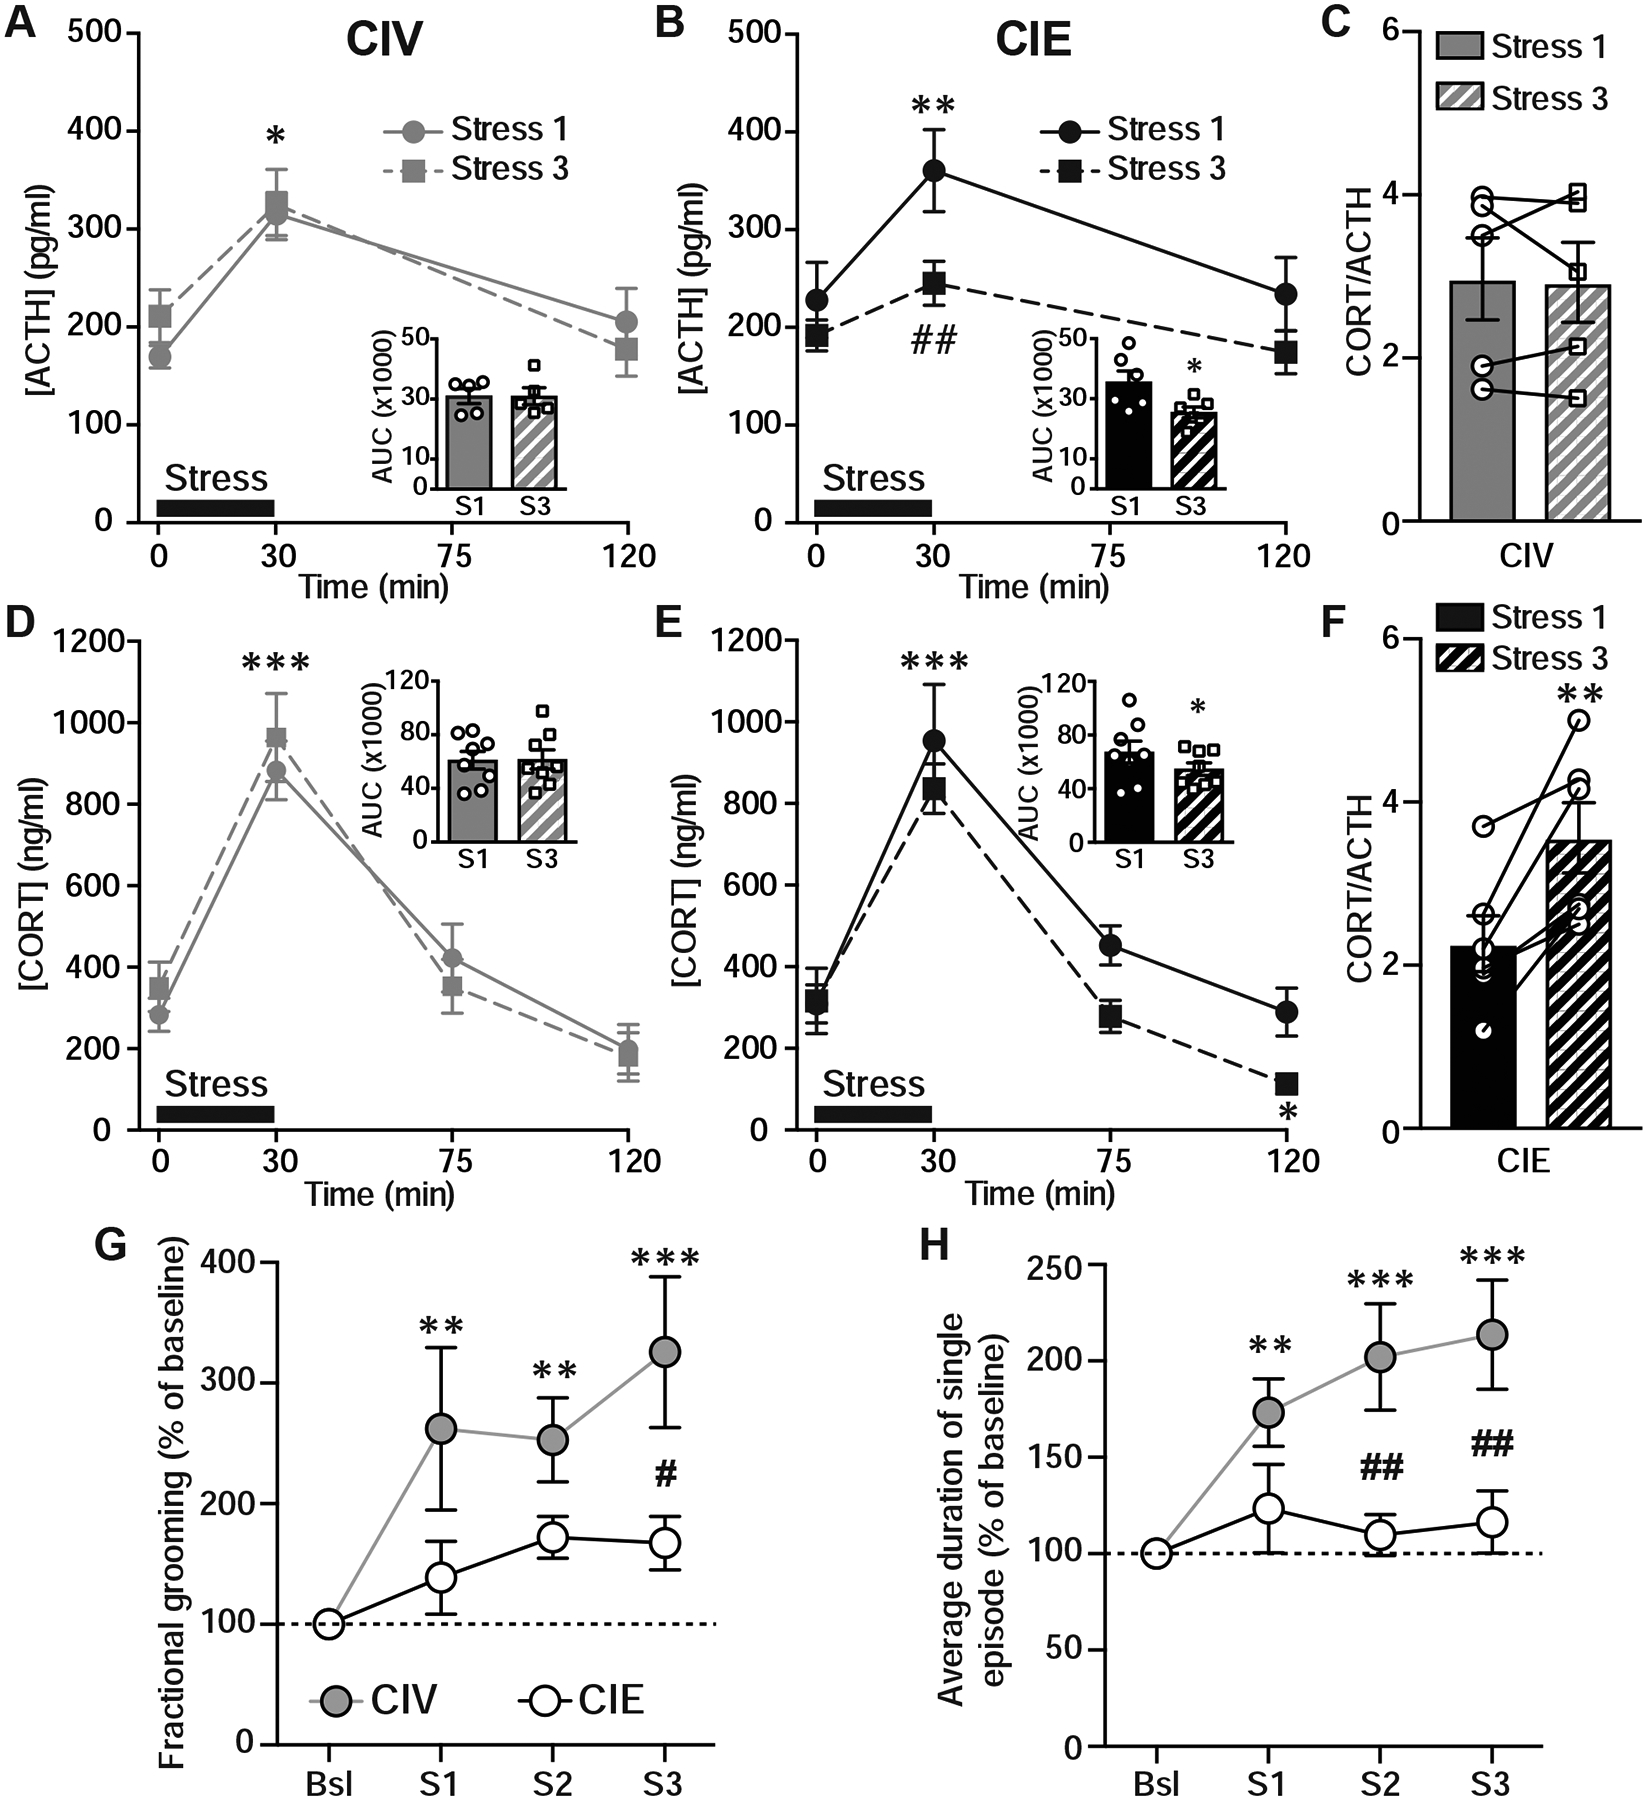
CIE reduces HPA axis hormonal responses and self-grooming responses to repeated restraint stress. A-B, Plasma ACTH levels in response to the restraint stress at t=0, 30, and 120 min post-stress in CIV (A) and CIE rats (B). Insert, integrated ACTH response, represented as area under the curve (AUC), to stress 1 (S1) and stress 3 (S3) in CIV (A) and CIE (B) rats. CIE significantly blunted ACTH response to stress 3. C, Summary graph of CORT/ACTH ratio at t=30 min post-stress 1 and stress 3 in CIV. D-E, Plasma CORT levels in response to restraint stress at t=0, 30, 75 and 120 min post-stress in CIV (D) and CIE (E) rats. Insert, integrated CORT response to S1 and S3 in CIV (D) and CIE (E) rats. CIE significantly reduced CORT response to stress 3. F, Summary graph of CORT/ACTH ratio at t=30 min post-stress 1 and stress 3 in CIE rats. CIE significantly increased CORT/ACTH in response to stress 3 compared to stress 1. G, Fractional time grooming, defined as the relative time spent grooming during the exploring time period, was significantly increased following stress in CIV rats, these increases were blunted in CIE rats. **p<0.01, ***p<0.001, baseline vs. stress; #p<0.05, CIV vs. CIE. H, CIE blunts stress-induced increases in average duration of a single grooming episode, expressed as % of baseline. **p<0.01, ***p<0.001, baseline vs. stress; ##p<0.01, CIV vs. CIE.
