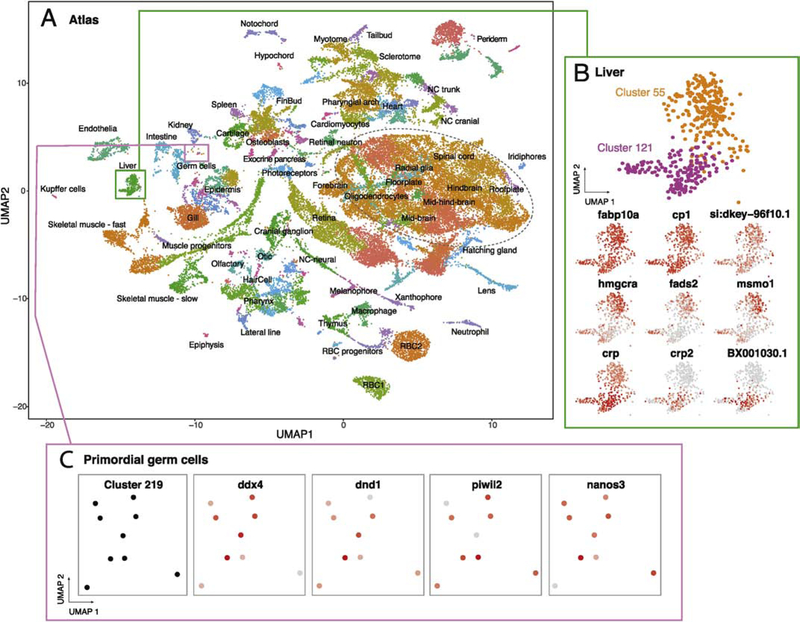
Figure 1.
scRNA-seq atlas of developing zebrafish embryos during organogenesis. (A) Clustering of cell types enables gene expression analysis across transcriptional cells types over developmental time. Colors correspond to labels which indicate a grouping of clusters and annotations. Green box describes clusters enlarged in B; pink box describes cluster enlarged in C. Dashed oval approximates the region described in Figure 2. (B) Heterogeneity within hepatocytes is revealed by the identification of two clusters (55 and 121) with different but related gene expression profiles. Common and differential gene expression between these clusters are plotted using red to indicate high levels of expression and grey for low expression (normalized for total expression of the gene, see methods). (C) Rare cells types, including primordial germ cells (PGCs), can be efficiently profiled and are restricted to a single cluster (219). Four markers of PGCs show high levels of expression within this cluster.

