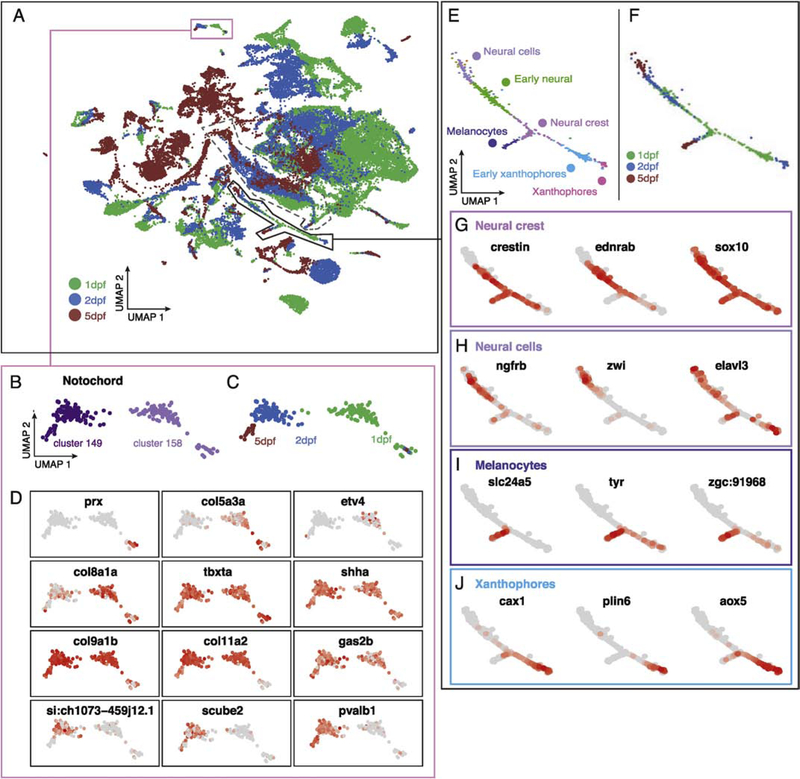
Figure 3.
Temporal gene expression analysis in the atlas using cell age. (A) Aggregating cells from 1, 2, 5 dpf embryos reveals age-related changes in gene expression for discrete clusters. Pink box describes notochord clusters enlarged in B-D; solid black line shows approximate region of neural crest lineages enlarged in E-J. Dashed line shows approximate region of retinal cells described in Figure 4. (B-C) Notochord clusters contain cells of distinct ages. (D) Differential gene expression analysis in developing the notochord. (E) Discrete clusters corresponding to cell type specification in neural crest lineages are annotated with cell-type and color coded by cluster. (F) Age of cells associated with neural crest lineage. (G-J) Differential gene expression analysis over time in neural crest progenitors (G), neural cells (H), melanocytes (I), and xanthophores (J) across developmental time.

