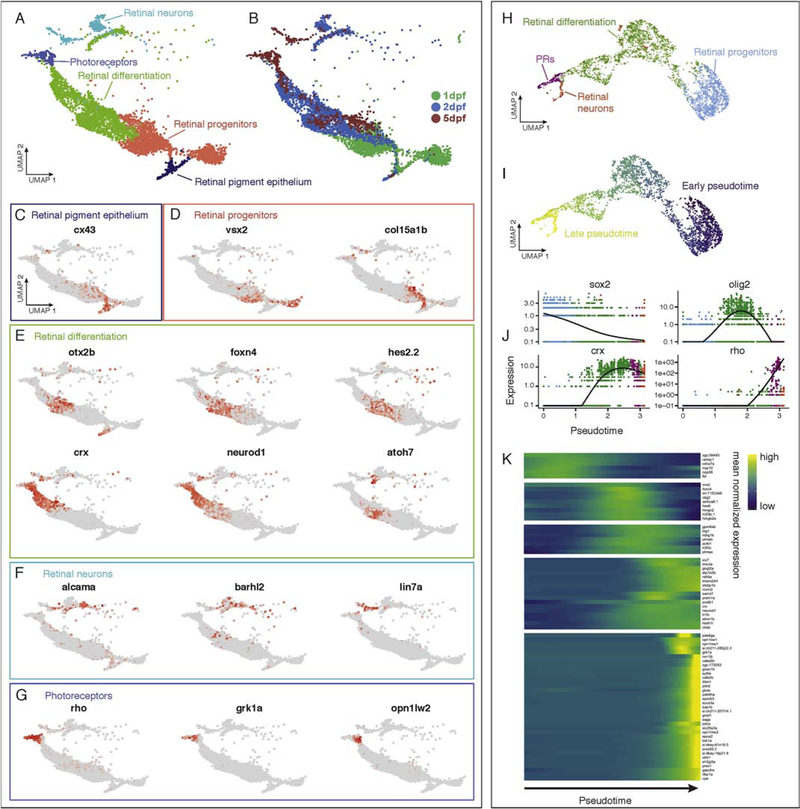
Figure 4.
Temporal and pseudotemporal gene expression analysis of the retina. (A) Retinal cells form continuous transitions in UMAP space. Colors correspond to groupings of clusters and annotations with the cells represented corresponding to the dashed oval in Figure 3A. (B) Age of cells associated with retinal cell clusters. (C-H) Differential expression analysis over time during retina development in clusters of putative (C) retinal pigment epithelium, (D) retinal progenitors, (E) differentiating retinal cells, (F) retinal neurons, and (G) photoreceptors. (H-K) Pseudotemporal analysis of retina neuron development in Monocle. (H) Monocle reconstruction of retinal neural lineages agrees with UMAP analysis and annotation (compare to A). (I) Monocle reconstruction of retinal lineage colored by pseudotemporal age. (J) Monocle analysis reveals progressive repression of sox2, activation of crx and rho, and transient activation of olig2 across pseudotime. (K) Heatmap of gene expression analysis associated with retinal cell type specification in Monocle.

