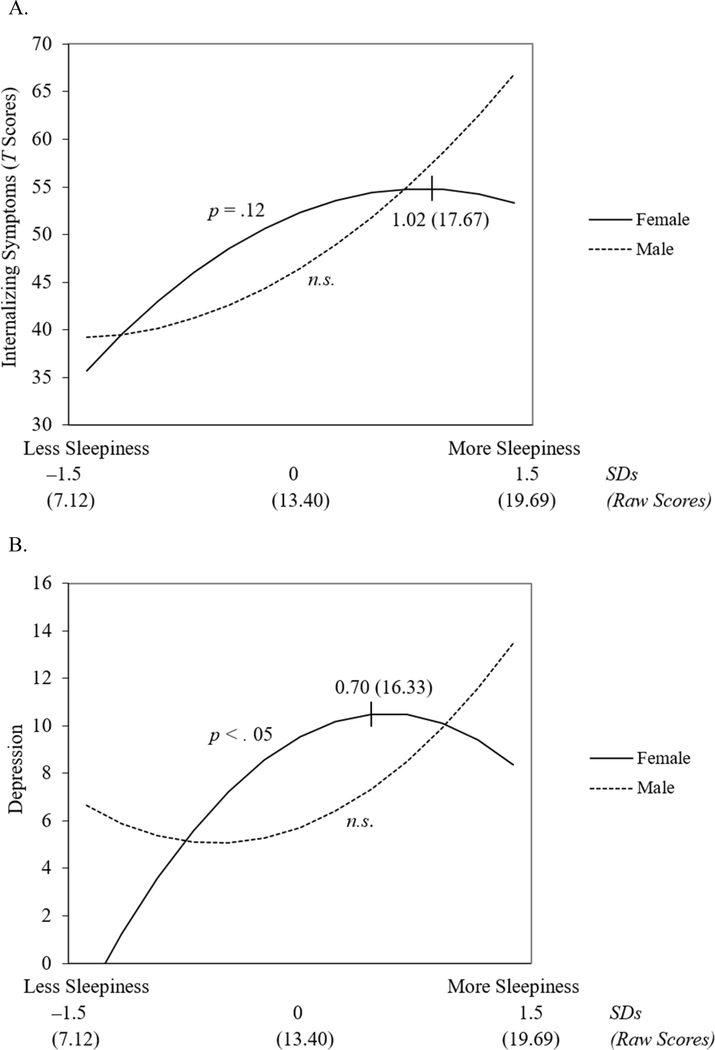
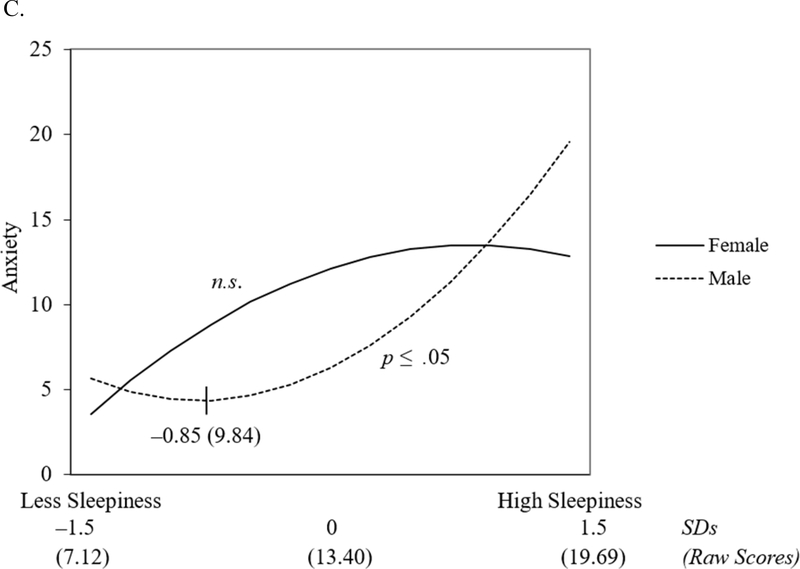
Figure 1.
Nonlinear effect for standardized sleepiness2 and sex predicting (A) internalizing symptoms, (B) depression, and (C) anxiety. Points were plotted at ± 1.5 SDs for standardized sleepiness. Peaks and troughs of nonlinear curves are represented in SDs with raw scores in parentheses. Internalizing symptoms were derived with YSR (T scores); depression symptoms were derived with CDI; anxiety symptoms were derived with RCMAS-2.


