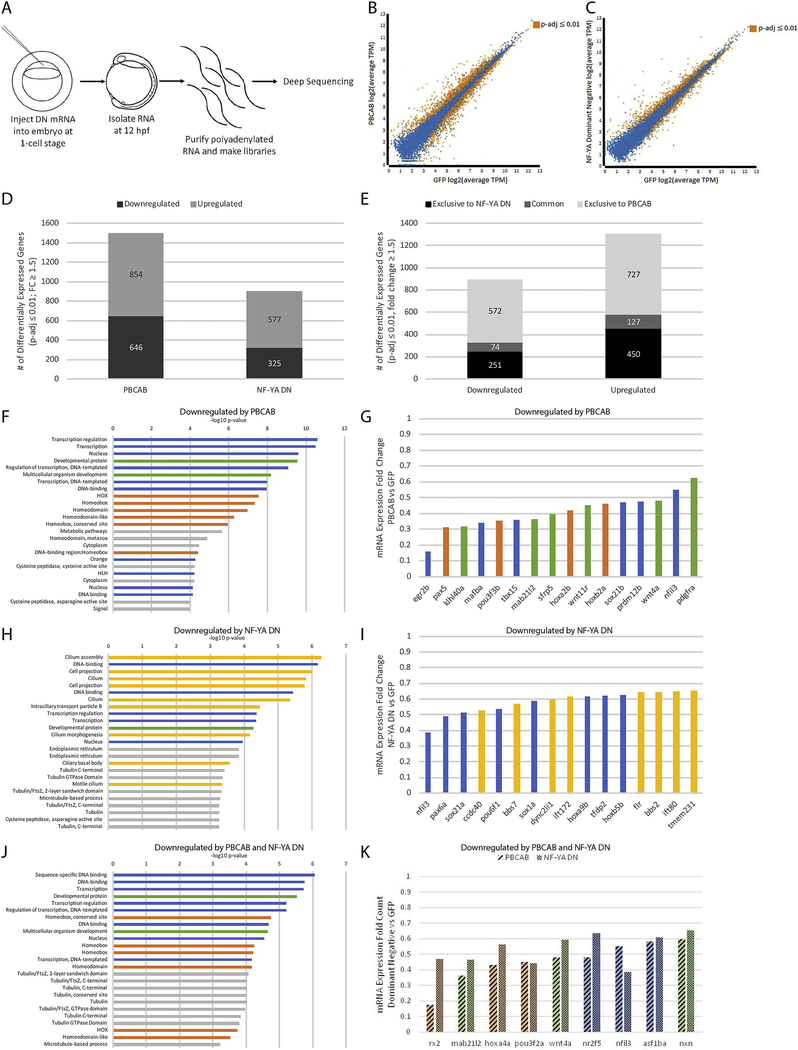
Figure 2: NF-Y and TALE TFs have both shared and independent transcriptional targets.
(A) Schematic of RNA-seq experiments. (B-C) Scatterplots of gene expression in PBCAB vs GFP-injected (B) and NF-YA DN vs GFP-injected (C) zebrafish embryos (expression presented as log2 of average TPM for multiple replicates; see methods). Expression of genes highlighted in orange is significantly different at 12hpf (padj≤0.01; Wald test in DESeq2). (D) Number of genes differentially expressed in PBCAB (left) or NF-YA DN (right) relative to GFP-injected embryos (p-adj ≤ 0.01; fold-change ≥ 1.5). (E) Breakdown of downregulated (left) and upregulated (right) genes exclusive or common to each experimental condition. (F, H, J) DAVID analyses showing the 25 most significant GO terms (EASE Score) associated with genes downregulated by PBCAB (F), NF-YA DN (H), and common to both (J). Blue bars correspond to transcription-related, green to embryogenesis-related, orange to homeodomain-related, yellow to cilia-related, and gray to other ontologies. (G, I, K) Selected genes downregulated by PBCAB (G), NF-YA DN (I), or both (K). Color coding is the same as in (F, H, J).

