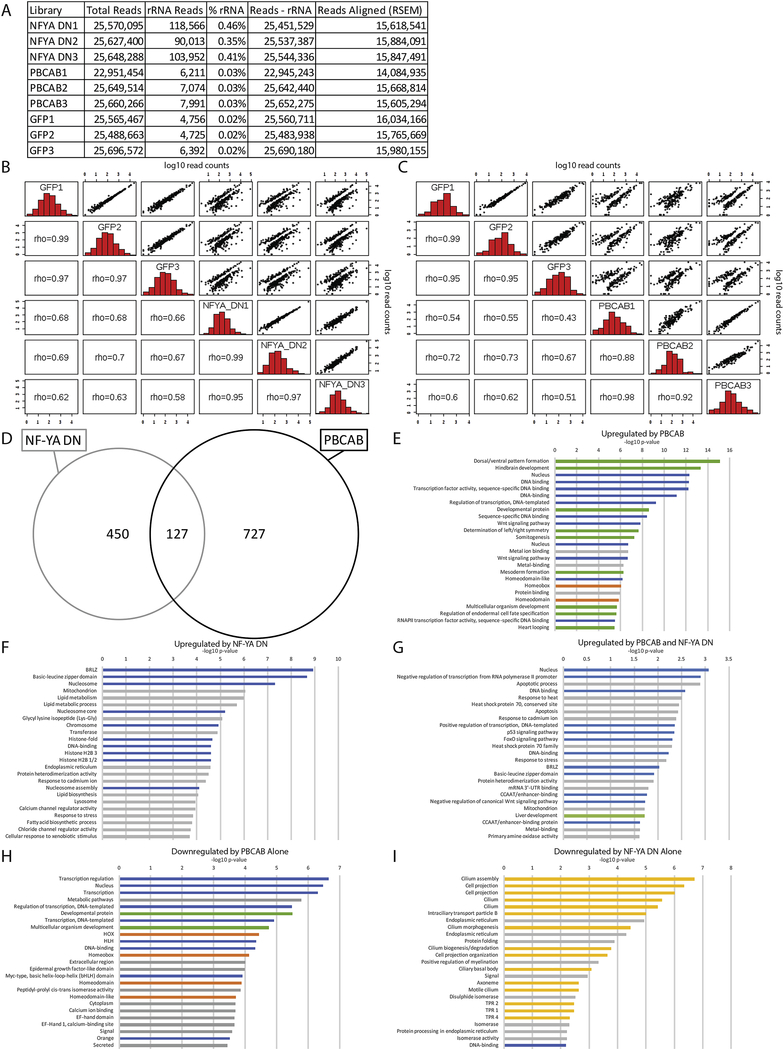
Figure 3: Identification of NF-Y and/or TALE-dependent genes in zebrafish.
(A) Read counts for the RNA-seq analysis. (B, C) Histograms, scatter plots, and Spearman’s rank correlation coefficient comparing each biological replicate of NF-YA DN with GFP (B) or PBCAB with GFP (C). (D) Venn diagram showing upregulated genes (p-adj ≤ 0.01; FC ≥ 1.5) in embryos injected with PBCAB or NF-YA DN. (E-I) GO terms associated with genes upregulated (p-adj ≤ 0.01, FC ≥ 1.5) by PBCAB (E), upregulated by NF-YA DN (F), upregulated by both PBCAB and NF-YA DN (G), downregulated exclusively by PBCAB (H) or downregulated exclusively by NF-YA DN (I). In E-I, blue bars correspond to transcription-related, green to embryogenesis-related, orange to homeodomain-related, yellow to cilia-related, and gray bars to other ontologies.

