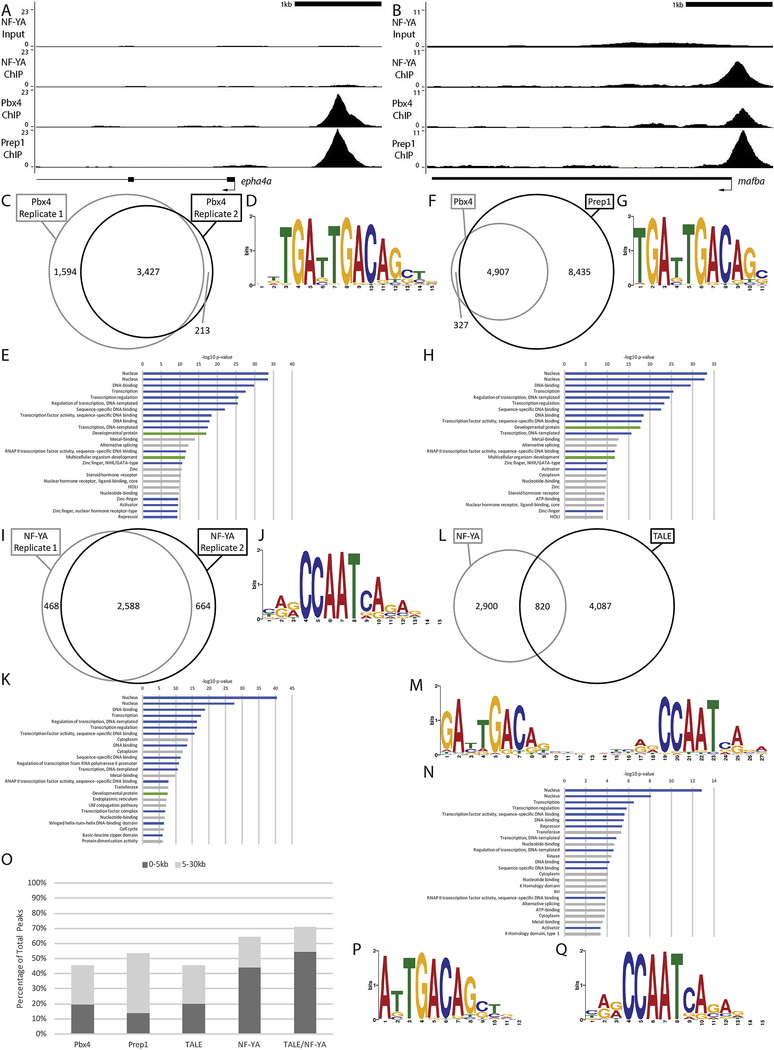
Figure 4: NF-Y and TALE occupy genomic elements associated with developmental and transcriptional control genes at ZGA.
(A-B) Representative UCSC Genome Browser tracks for NF-YA, Pbx4 and Prep1 ChIP-seq analyses at 3.5hpf. (C, F, I, L) Venn diagrams showing the overlap (at least 1bp shared between 200bp fragments centered on peaks) of two Pbx4 ChIP-seq replicates (C), the overlap of Pbx4 and Prep1 ChIP-seq peaks (F), the overlap of two NF-YA ChIP-seq replicates (I) and the overlap of TALE and NF-Y ChIP-seq peaks (L). (D, G, J, M) The top sequence motif returned by MEME for Pbx4-occupied sites (D), Pbx4/Prep1 co-occupied sites (G), NF-YA occupied sites (J) and TALE/NF-YA co-occupied sites (M). (E, H, K, N) The top 25 gene ontology (GO) terms returned by the GREAT analysis tool for genes associated with Pbx4-occupied sites (E), Pbx4/Prep1 co-occupied sites (H), NF-YA occupied sites (K) and TALE/NF-YA co-occupied sites (N). (O) Chart showing percent of ChIP-seq peaks found within 5kB or 30kB of a promoter. (P, Q) Top sequence motif returned by MEME for peaks bound by TALE, but not NF-YA (P) and peaks bound by NF-YA, but not TALE (Q). Only peaks with a 10-fold or greater enrichment over input (FE≥10) were considered for the analyses in C-Q.

