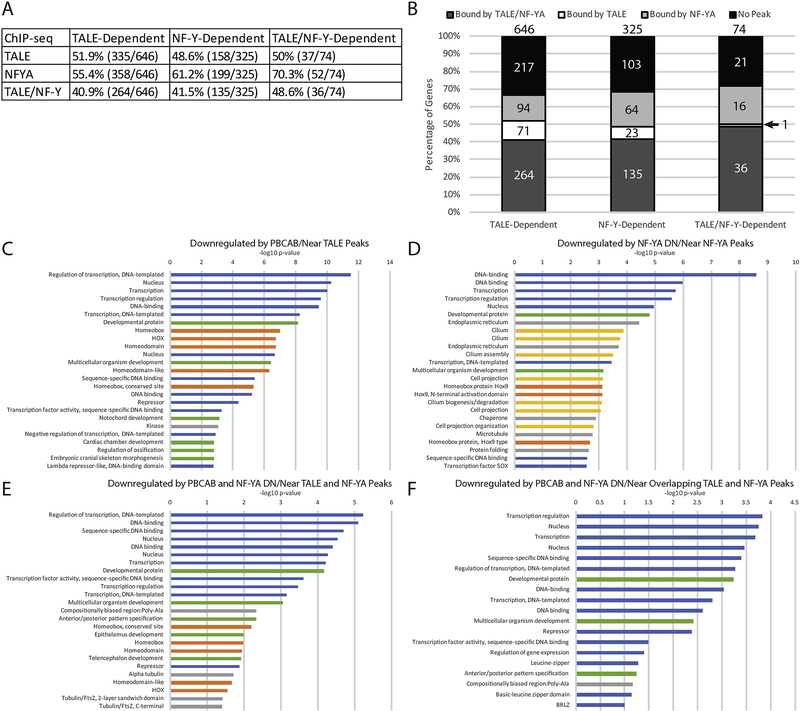
Figure 6: Combinatorial function of NF-Y and TALE defines distinct gene expression programs.
(A) Table showing correlation between NF-Y and/or TALE-dependent genes and binding by the corresponding TF at a nearby site (ChIP peaks enriched by 4-fold or greater over input were considered). (B) Graphical breakdown of NF-Y and/or TALE occupancy near NF-Y and/or TALE-dependent genes. (C-F) Top 25 GO terms returned by DAVID for TALE-dependent genes associated with TALE peaks (C), NF-Y dependent genes associated with NF-YA peaks (D), TALE/NF-Y dependent genes associated with both NF-YA and TALE peaks (E), and TALE/NF-Y dependent genes associated with overlapping TALE and NF-YA peaks (F). Blue bars correspond to transcription-related, green to embryogenesis-related, orange to homeodomain-related, yellow to cilia-related, and gray bars to other ontologies.

