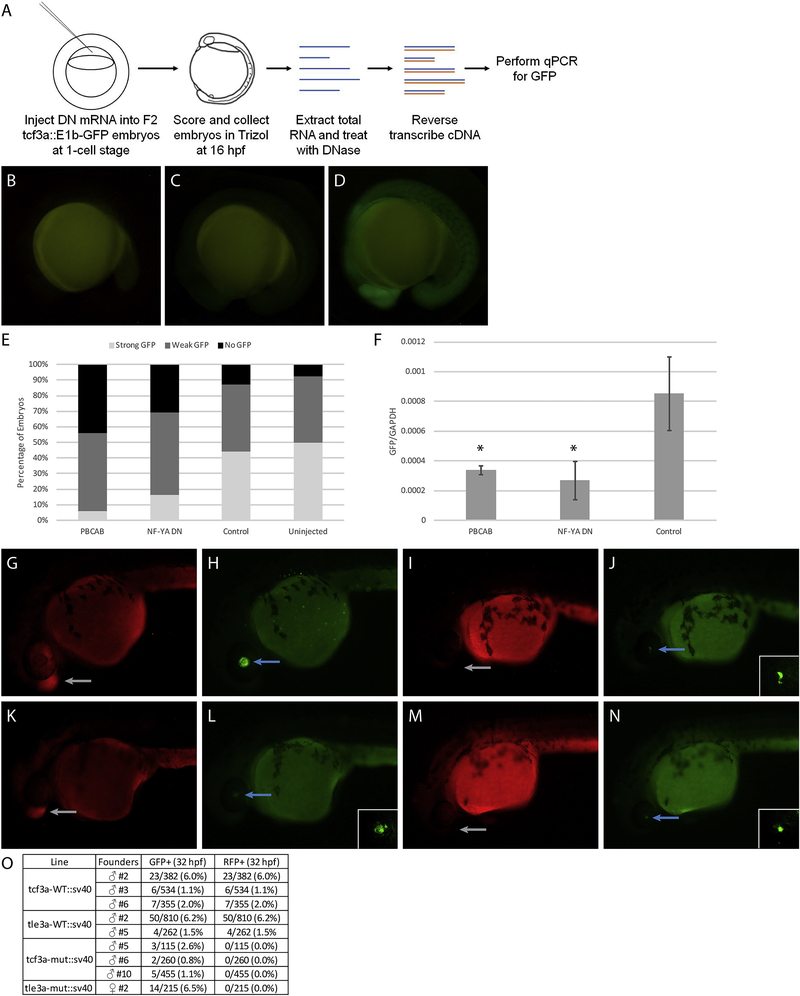
Figure 9: Disruption of TALE and NF-Y function reduces enhancer activity.
(A) Schematic showing workflow for dominant negative disruption of tcf3a:E1b-GFP. (B-D) Representative images showing no GFP (B), weak GFP (C), and strong GFP (D) of dominant negative-injected embryos. (E) Distribution of GFP expression in uninjected embryos and embryos injected with PBCAB, NF-YA DN or control RNA. (F) RT-qPCR-based detection of GFP expression in embryos injected with PBCAB, NF-YA DN or control RNA. Data are shown as mean +/− SEM. Statistical test: unpaired t-test. (G-N) Representative examples of RFP (G, K, I, M) and GFP (H, L, J, N) signal in tcf3a-WT:sv40 (G, H), tcf3a-mut:sv40 (I, J), tle3a-WT:sv40 (K, L) and tle3a-mut:sv40 (M, N) embryos at 32hpf. Insets in panels L, J, N show higher magnification of GFP expression in lens. Note that embryo in panels G, H is at a later stage than embryos in panels I-N. (O) Table quantifying results from experiment in panels G-N.

