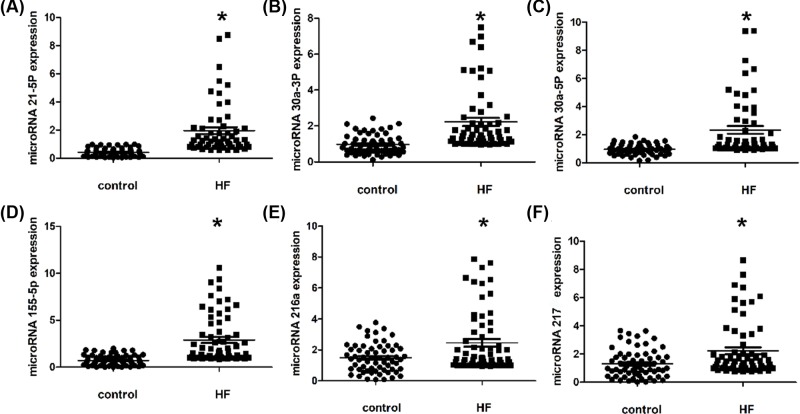
Figure 2. Plasma miRNA levels in the validation population.
The scatter plots show the expression levels of (A) miR-21-5p, (B) miR-30a-3p, (C) miR-30a-5p, (D) miR-155-5p, (E) miR-216a and (F) miR-217 measured by quantitative real-time polymerase chain reaction (qRT-PCR) in patients with HF and control subjects (n = 62). From the analysis results, we can see that the six kinds of miRNA statistics show that in the heart failure samples have a significant upward trend. The relative miRNA expression levels were normalized to cel-miR-39 and calculated by -ΔΔCt. Differences between each groups were compared by Kruskal–Wallis ANOVA test; ∗P < 0.05.

