
Figure C1.
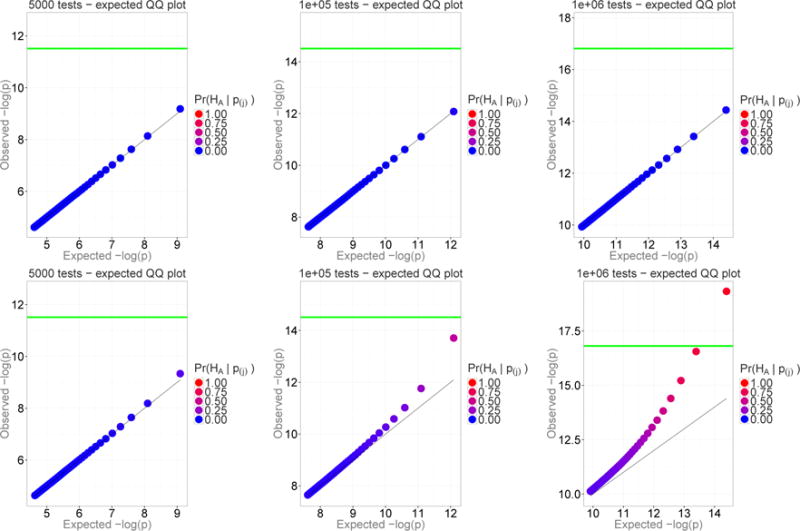
The proportion of genuine signals among the top hits increases with sample size. In these QQ plots, the prior probability of genuine signal is 0.1%. The bottom row replicates the model of the top row but for a ten-fold increases in the sample size.