
Figure 5.
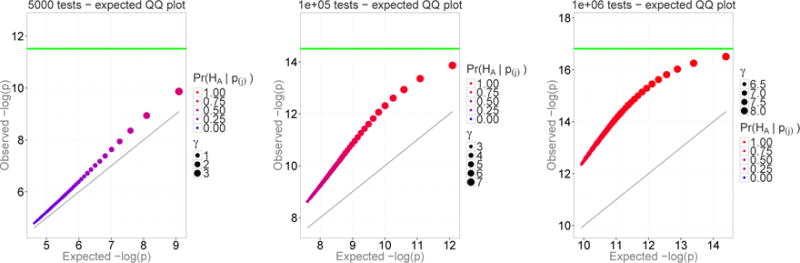
The proportion of genuine signals among the top 50 P-values, none of which passed a significance threshold (min(p) > 0.05/k). The color of the dots represents the posterior probability of a genuine result, the size of the dots represents the magnitude of the effect size, and the green line indicates the Bonferroni-adjusted significance threshold.