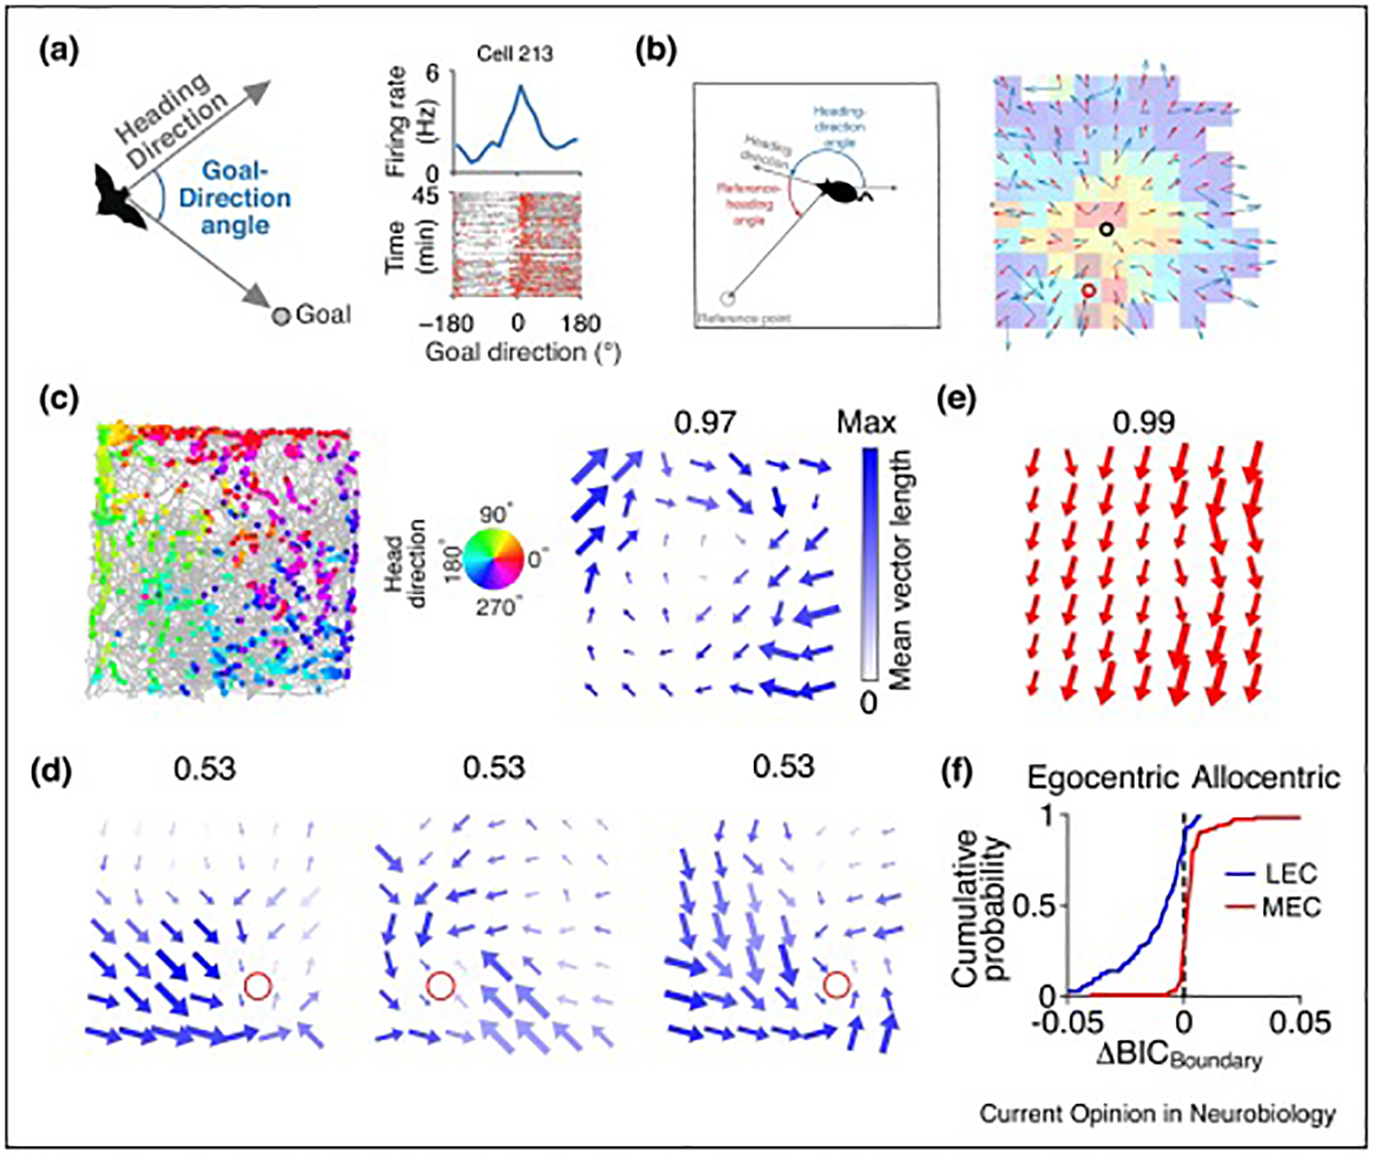
Figure 3. Egocentric representation in the hippocampus and lateral entorhinal cortex.

(a) Some hippocampal CA1 cells in bats showed egocentric goal direction selectivity. Left, Schematic for egocentric goal direction. Top right, an example goal direction cell that has the highest firing rate when the goal direction is 0° (the bat flies toward the goal location). Bottom right, trajectories of goal-direction angles along the behavioral session (gray), with spikes overlaid (red). Reproduced, with permission, from Sarel, Finkelstein et al. [28].
(b) Activity of some place cells in mouse hippocampal CA1 can be modulated by egocentric heading direction to a reference point in the environment. Left, Schematic of the egocentric heading direction relative to a specific reference point. Right, Heat map: spatial firing rate map; red circle: center of mass for the rate map; blue arrows: heading direction tuning within each spatial bin; black circle: the reference point obtained by a model based on the real heading direction tuning; red arrows: heading direction tuning fitted by the model in each spatial bin. Reproduced, with permission, from Jercog et al. [29].
(c) An example cell in LEC showed selectivity for egocentric bearing of the arena boundary/center. Left, trajectory (gray lines) and position and head direction of the rat when the cell fired (colored dots). Middle, Color wheel denotes the head direction. Right, Local head direction tuning in each spatial bin. Arrow direction: preferred head direction; arrow size: firing rate; color saturation: the mean vector length of the tuning curve (MVL); number on top: maximum MVL.
(d) An example LEC cell tuned for egocentric bearing of goal location in a goal-oriented task. In this task, a single food well (red circle) was shifted from the standard goal location in session 1 (left) to a different location in session 2 (middle), and then back to the original standard location in session 3 (right). Local head direction tuning is showed as in (c).
(e) An example cell in MEC showed selectivity for allocentric head direction, as demonstrated by all arrows pointing in the same, allocentric direction.
(f) LEC represents spatial information in an egocentric frame of reference, whereas MEC utilizes an allocentric frame of reference. Bayesian information criterion (BICBoundary) indicates the goodness of fit of a cell’s activity to an egocentric bearing model or an allocentric bearing model. ΔBICBoundary describes the difference of goodness of fit between the two models, in which a negative value means the cell prefers the egocentric frame of reference, whereas a positive value means the cell prefers the allocentric frame of reference. (c-f) Reproduced, with permission, from Wang, Chen et al. [33].’
