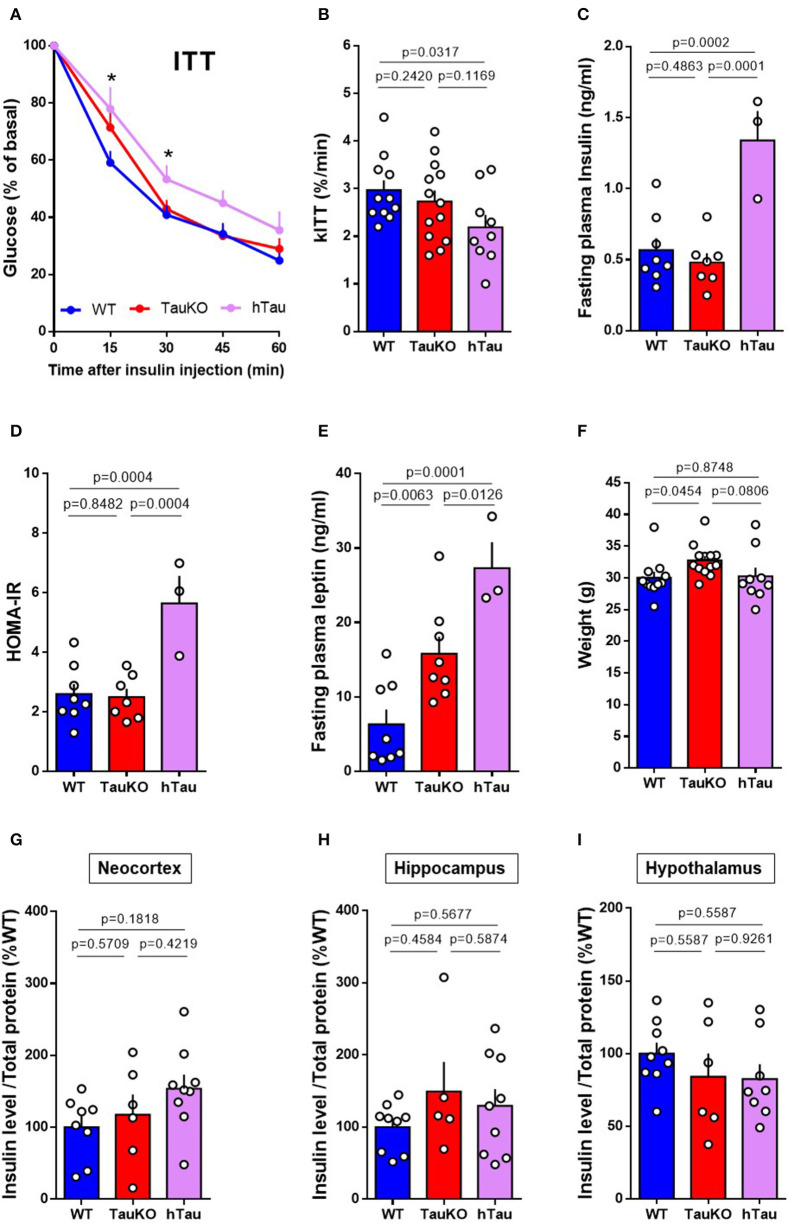
Figure 1.
Peripheral insulin sensitivity and brain insulin levels of TauKO and hTau mice. (A) Insulin Tolerance Test (ITT) with 20 weeks old WT, TauKO, or hTau mice. After 4 h fasting, mice received 1U/kg of intraperitoneal insulin and blood glucose levels were measured at the designated time points from tail vein blood (n = 11 WT; 13 TauKO; 9 hTau). (B) Bar graphs representing the kinetic constants for glucose disappearance (Kitt) calculated from the time course plot (n = 11 WT; 13 TauKO; 9 hTau). (C) Plasma insulin levels after fasting measured by ELISA (n = 8 WT; 7 TauKO; 3 hTau). (D) HOMA-IR calculated from glucose (mMol/L) and insulin (mU/L) levels, using the formula: HOMA = fasting glucose (mMol/L) x fasting insulin (mU/L)/22.5 (n = 8 WT; 7 TauKO; 3 hTau). (E) Plasma leptin levels after fasting measured by ELISA (n = 8 WT; 7 TauKO; 3 hTau). (F) Body weight (n = 11 WT; 13 TauKO; 9 hTau). (G–I) Levels of insulin in lysates from the neocortex (n = 8 WT; 6 TauKO; 9 hTau), hippocampus (n = 9 WT; 5 TauKO; 9 hTau), and hypothalamus (n = 9 WT; 6 TauKO; 8 hTau), measured by ELISA. Data are representative of two independent experiments. *p < 0.5.

