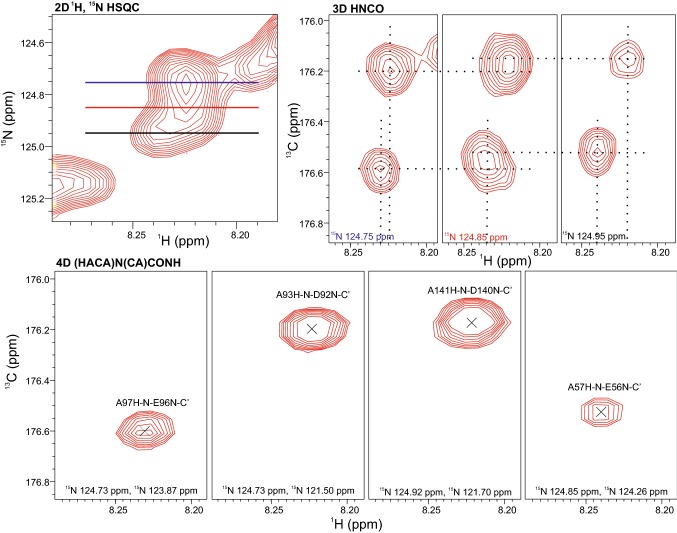
Fig. 6.
Resolving power of the i-1 amide nitrogen in the fourth dimension. Compared are 3D HNCO and 4D (HACA)N(CA)CONH planes from the 1H, 15N-HSQC region shown in the upper left corner. From 2D HN-C′ planes retrieved from the 3D HNCO at 15N frequencies marked with lines of different colors it is difficult to determine the number of peaks present and their chemical shifts in this overlapping peak area of the 1H, 15N-HSQC. Tentative peak positions are shown with broken lines. In contrast, in the 4D (HACA)N(CA)CONH spectrum four nicely resolved peaks are found. The fourth dimension, i.e. the second chemical shift marked in the 4D planes effectively spreads peaks overlapping in the 2D and 3D spectra

