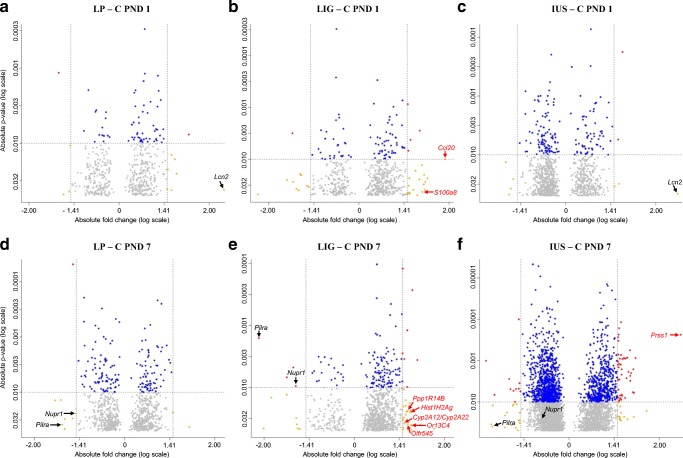
Fig. 3.
Volcano plots show all genes differentially expressed (p < 0.05) compared with the control group. a Group LP on postnatal day (PND) 1. b LIG on PND 1. c IUS on PND 1. d LP on PND 7. e LIG on PND 7. f IUS on PND 7. Each point represents a gene. Points are differentiated by color depending on fold change (fc) and p value (gray, fc < |1.5| and p < 0.05 but > 0.01; blue, fc < |1.5| and p < 0.01; yellow, fc ≥ |1.5| and p < 0.05 but > 0.01; red, fc ≥ |1.5| and p < 0.01). Points labeled with gene symbols in black represent transcripts relevantly altered in at least two IUGR groups, points labeled in red represent model-specific alterations

