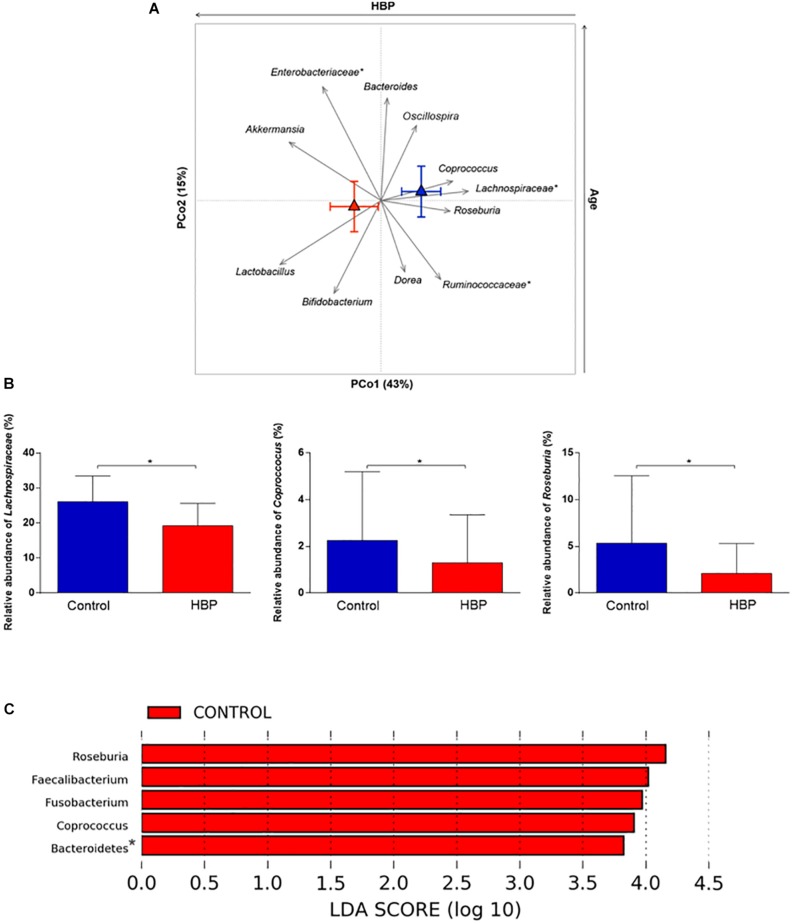
FIGURE 2.
Intestinal microbial components driving the separation between hypertensive (HBP) and normotensive (control) subjects. (A) Genus-level relative abundance vectors with statistically significant contribution to the ordination space (p < 0.05, permutational correlation test) were overlaid onto the PCoA plot of weighted UniFrac distances (see Figure 1B). Triangles, centroids for each group (red, HBP; blue, control) with indication of standard errors on each coordinate axis. *, unclassified OTU reported at higher taxonomic level. PCo1 was negatively associated with the presence of HBP while PCo2 correlated positively with age. (B) Bar plots showing the relative abundance of the Lachnospiraceae family and the genera Coprococcus and Roseburia in HBP and control subjects. *p = 0.02; p = 0.04; p = 0.003, respectively; Mann–Whitney U test. (C) Linear discriminant analysis (LDA) effect size (LEfSe) analysis. LDA scores indicate differentially represented genera between groups (the logarithmic threshold for discriminative features was set to 2.0). *, unclassified OTU reported at higher taxonomic level.

