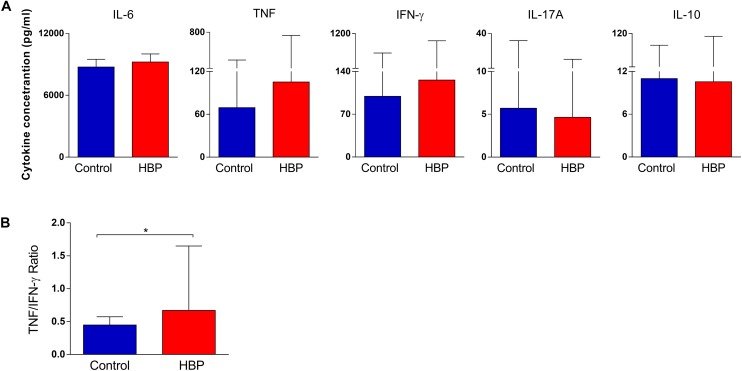
FIGURE 3.
Comparison of cytokine production in the supernatant of PBMCs between the high blood pressure group (HBP) and control group (Control). (A) The bars represent the median and interquartile of the cytokine concentration (pg/ml), as determined by flow cytometry, for each study group. (B) The bars represent the TNF/IFN-γ ratio. *, p = 0.02, Mann–Whitney U test.

