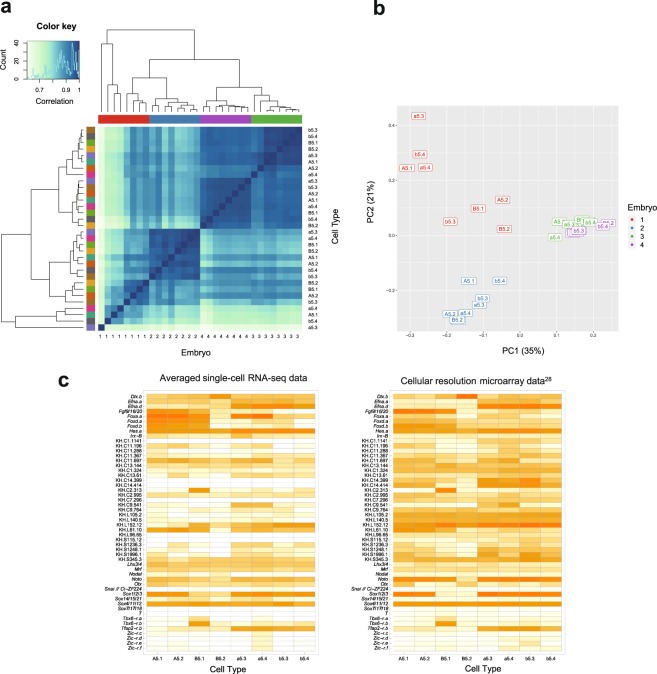
Figure 2.
Our dataset exhibits low technical variability within batches and agrees well with microarray data. (a) Clustered heat map of the symmetrical correlation matrix of normalised expression data from HiSeq samples (excluding ERCC counts and genes with zero counts), with the histogram in the top left providing the colour key for the correlation matrix. The embryo and cell type annotations for each sample are shown on different axes, but the samples are arranged in the same order. The samples are colour-coded by embryo along the top and by cell type on the left with the same hierarchical clusters shown in both cases. (b) PCA plot of the same data showing the first two components, which explain 56% of the total variance. The samples are colour-coded by embryo and labelled by cell type. (c) Heat maps of averaged φ-transformed →scRNA-seq measurements (left) and averaged cellular resolution microarray data (right)28. Gene orders are the same in both heat maps.

