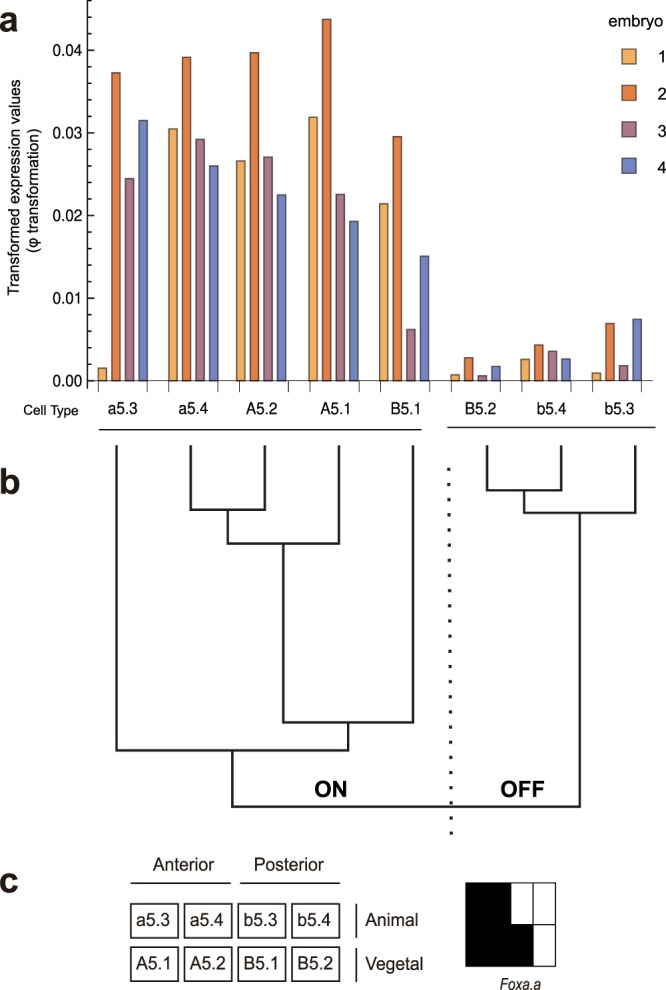
Figure 3.

Schematic diagram of the method for finding cell-type specific expression patterns. (a) Gene expression profile of Foxa.a across four embryos and eight cell types. (b) The eight cell types are grouped into ON and OFF by performing single-linkage hierarchical clustering of expression values. The two top-level clusters determine the split between ON and OFF cells. (c) Schematic depiction of the expression pattern for Foxa.a. Legend of the eight cell types grouped by embryonic position (left) and expression classification of these cells (right, ON – black, OFF - white).
