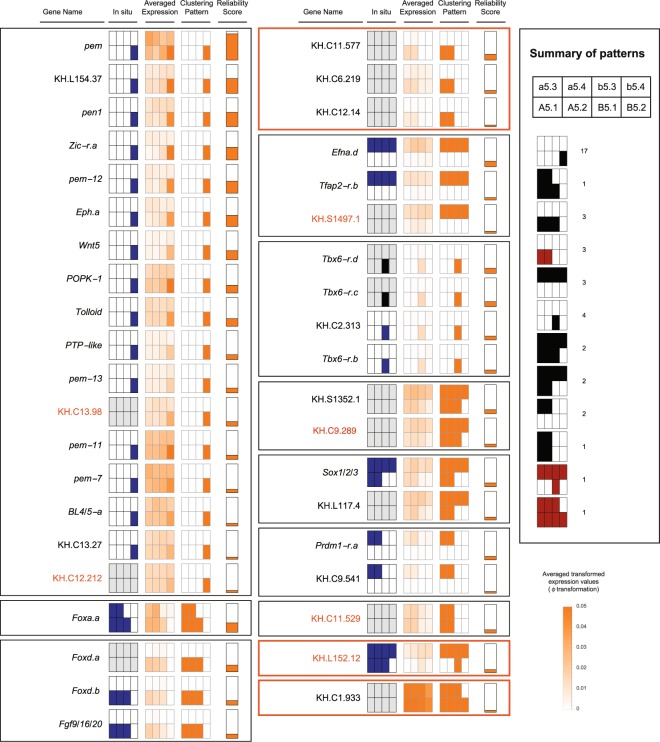
Figure 4.
All previously known patterns occur in the top 40 genes when ranked according to their Transquartile Range (TQR). Expression summary plots of the top 40 genes, grouped by pattern, with an orange border indicating an unknown pattern. The arrangement of cells in each pattern is shown in the summary box on the right, together with the number of genes per pattern, whether known (black) or unknown (red). Genes whose patterns we validated are highlighted in orange. For each gene, the columns indicate the gene name, any previously known in situ pattern in blue (grey if not known), the average of the transformed expression values (clipped above 0.05), the pattern resulting from clustering, and finally, the TQR as the reliability score, scaled for visualization. The in situ probe for Tbx6-r.b also detects Tbx6-r.c and Tbx6-r.d (indicated by a black in situ pattern).

