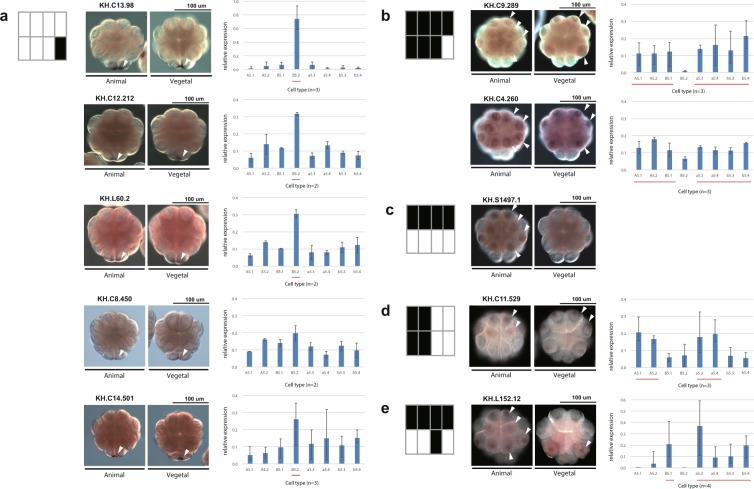
Figure 5.
Pattern discovery results are validated by in situ hybridisation and single-cell qPCR. (a–e) For each pattern being tested (left), the in situ hybridisation results are shown from the animal and vegetal side (middle). The arrowheads pointing to the expressing cells are shown on only one side of the embryo. Gene expression levels for each cell type were measured by single-cell qPCR. The qPCR measures for the cell types of each embryo were scaled to add to 1. The bar charts (right) show the mean of the resulting values of biological replicates, with whiskers indicating the range. The lines under the bars indicate the cells of the expression pattern being tested. The number of replicates of each gene is shown under each bar chart.

