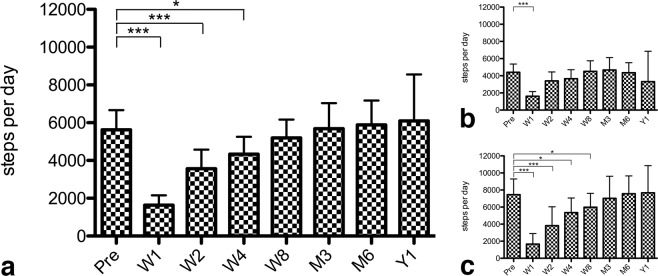
Figure 2.
Bar graphs with whiskers (95% confidence interval), illustrating the absolute change in the daily steps of the total cohort (a), n = 18 patients with lumbar spine diseases (b) or n = 12 patients with cervical spine disease (c). The x-axis indicates the time from preoperative (Pre) to 52 weeks postoperative. The y-axis indicates the mean number of steps. The levels of significance are indicated as *(p ≤ 0.05), **(p ≤ 0.005) or ***(p ≤ 0.001).

