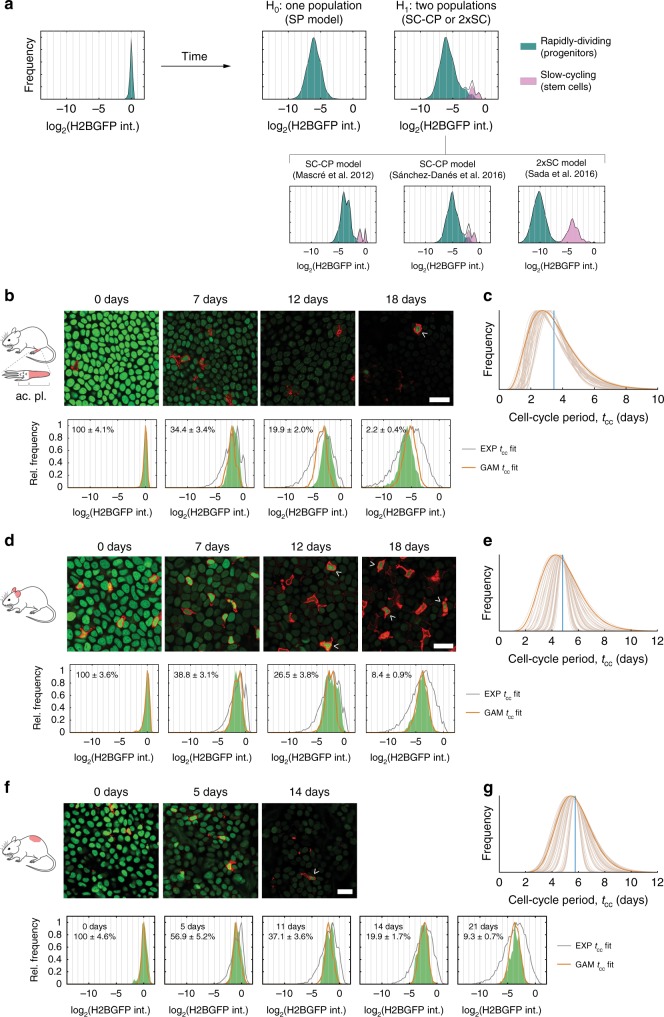
Fig. 4. H2BGFP-dilution and cell-cycle inference in skin epidermis at different sites.
a Theoretical distributions of individual-cell H2BGFP intensities expected after 3 weeks dilution under the SP, SC-CP and 2xSC scenarios assuming gamma-distributed cell-cycle periods. Simulations considered an average division rate for stem cells 4× slower than for progenitors in SC-CP and 2xSC (top panels). Predictions of each model using published parameters are shown below. All theoretical SC-CP or 2xSC scenarios represented in this figure were significant by 6 different unimodality tests (see Supplementary Data 3). b, d, f Representative confocal z stacks of hindpaw (plantar), ear and dorsal epidermal basal layer, respectively, from R26M2rtTA/TetO-H2BGFP mice, showing H2BGFP (green) and immunostaining for pan-leukocyte marker CD45 (red). Analysis of hindpaw epidermis was confined to the posterior, plantar region (pl.), excluding the acrosyringia (ac.), cartoon. Label-retaining cells (LRCs) are CD45+ leukocytes (arrowheads). Scale bars, 20 μm. Images shown are representative of a total of 18 fields of view from 3 mice at 0 and 12 days, 14 fields of view from 3 mice at 7 and 18 days in (b), 18 fields of view from 3 mice at 0, 7 and 12 days and 12 fields of view from 2 mice at 18 days in (d), and 20 fields of view from 4 mice at 0 and 11 days and 17 fields of view from 4 mice in (f). Lower panels: Individual-keratinocyte H2BGFP intensity levels (in green) with mean ± s.e.m. values from different fields of view. Best fits for the SP model with exponential- (gray) or gamma-distributed cell-cycle periods (orange lines) are shown. See Supplementary Data 2 for raw intensity values and summary statistics. c, e, g Best estimates for the (gamma) distribution of the keratinocyte cell-cycle times in hindpaw, ear, and dorsal epidermis, respectively, estimated from fits to H2BGFP-dilution data. Conservative solutions (in dark orange) are used for further inference. Vertical blue lines: average cell-cycle period per site: 〈λ〉 = 2.0, 1.5, 1.2/week for paw (c), ear (e), and dorsum (g), respectively.

