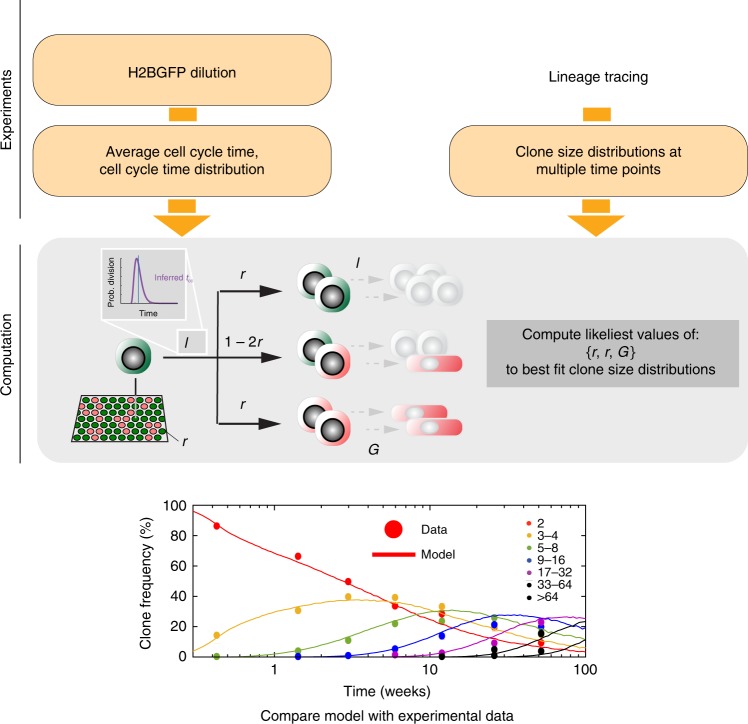
Fig. 6. Method for single-progenitor model testing and parameter inference.
Method to single-progenitor model testing and infer model parameters. Orange boxes indicate experiments and resulting data, gray box computational model and parameter estimation. Italics indicate parameters in the SP model. The multimodality testing of H2B-GFP data showed that there is a single population dividing at the same average rate in epidermis and esophagus, consistent with the SP model (Fig. 3d). To test the SP model, the average cell-cycle time (λ) and cell-cycle time distribution were inferred from H2B-GFP experiments. These values are used in computational analysis to estimate the values of the other parameters in the SP model, the proportion of progenitor cells in the basal layer ρ, the proportion of symmetric cell division outcomes r, and the stratification rate of differentiating cells leaving the basal cell layer (Γ). Multiple sets of values for the unknown parameters were tested. For each set of unknown parameter values 100,000 progenitor-derived clones were simulated (lines) and inferred clone-size distributions compared with experimental ones (points) obtained from lineage tracing. The likeliest sets of parameter values were obtained by maximum likelihood estimation for each linage tracing data set. The quality of the fit was assessed by determining whether the simulated values lie within the 95% confidence interval of the experimental clone-size measurements at each time point.

