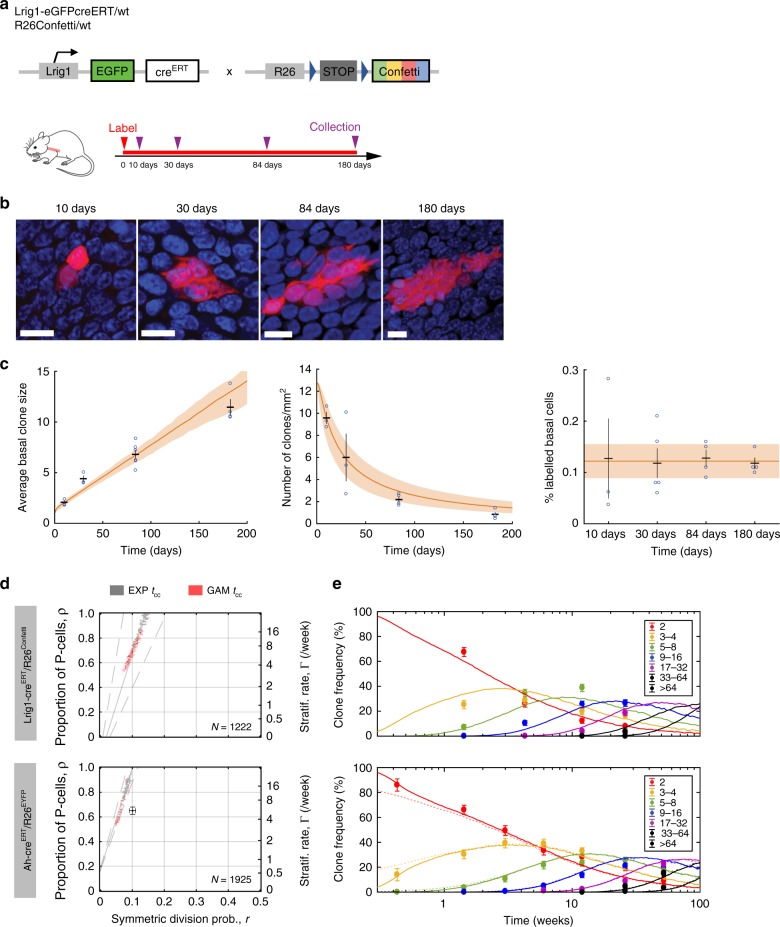
Fig. 7. Quantitative lineage tracing in esophageal epithelium.
a Protocol: clonal labeling was induced in Lrig1-eGFPcreERT/wt R26flConfetti/wt mice and samples analyzed at different times from 10 to 180 days post induction, as single labeled cells develop into clones. See Supplementary Data 5 for source data for panels (c) and (e). b Rendered confocal z stacks of the esophageal basal layer showing typical RFP clones (red) at the times indicated. Blue is DAPI. Scale bars, 10 μm. Images are representative of 104 RFP clones (10 days), 75 RFP clones (30 days), 106 RFP clones (84 days), and 274 RFP clones (180 days). c Quantitative characteristics of the labeled clone population over time: average basal-layer clone size (i.e., mean number of basal cells/surviving clone) (left panel), average density of labeled clones in the basal layer (middle panel), average fraction of labeled basal cells at the indicated time points (right panel). Observed values are shown in individual biologically independent mice (blue circles, n mice = 3 at 10 and 30 days, 6 at 84 days, and 4 at 180 days) with error bars (black) indicating mean ± s.e.m. of all mice at each time point. A total of 300 or more clones was quantified at each time point. Orange lines: SP-model fit (shaded area corresponds with 95% plausible intervals). Orange line and shading in last panel show mean and s.e.m. across all time points (from n = 16 mice), which is consistent with homeostatic behavior. d SP-model parameter inference on Lrig1- and Ah-CreERT driven lineage tracing data sets from esophagus5. Parameter estimates are affected by the underlying modeling assumptions on the cell-cycle period, whether default exponential cell-cycle time distributions were considered (solutions in gray) or realistic gamma distributions implemented, as inferred from the cell-proliferation analysis (solutions in orange). Regions within the dashed gray lines fall consistent with the predicted ρ/r ratios from the linear scaling of the average clone size. The total number of clones counted in each data set is displayed in the corresponding graph and previous parameter estimates given in ref. 5 shown as black error bars. e Experimental Lrig1- and Ah-CreERT-derived basal-layer clone sizes from ref. 5 (dots with error bars indicating the standard error of a proportion) fit well with the SP model, with gamma-distributed cell-cycle times (lines; prediction from maximum likelihood estimation). Dim dashed lines: fits from ref. 5. Frequencies for each clone size (basal cell number) are shown in different colors. n = 3 biologically independent mice at each time point except for the Lrig1/confetti where n = 6 mice at 12 weeks and 4 mice at 26 weeks.

