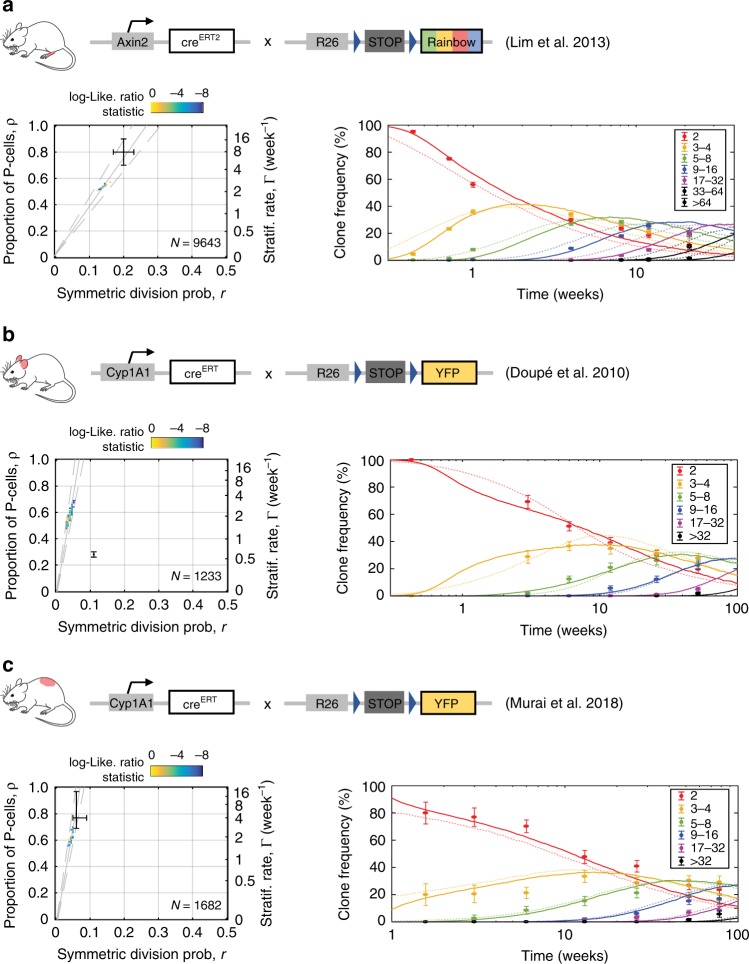
Fig. 8. The single-progenitor model fits clone dynamics in different regions of skin epidermis.
a–c Left panels: SP-model parameter inference on lineage tracing data sets from paw epidermis11 using Axin2-creERTR26Rainbow animals (a), and ear32 and dorsal22 interfollicular epidermis in AhYFP mice (b and c, respectively). Parameter estimates are obtained by MLE based on SP-model simulations constrained by the cell-cycle period distribution inferred from each corresponding cell-proliferation analysis. Regions within the dashed gray lines fall consistent with the predicted ρ/r ratios from the linear scaling of the average clone size. The total number of clones counted in each data set is displayed in the corresponding graph. Black bars are parameter estimates given in the original publications shown, centre is the mid range and bars indicate the maximum and minimum plausible parameter values in simulations in each paper (a, b, c). Right panels: Experimental Axin2- (a; from ref. 11) and Ah- (b and c; from refs. 32 and 22) derived basal-layer clone sizes (dots indicate mean ± standard error of proportion) give an excellent fit with the SP model with gamma-distributed cell-cycle times (lines; prediction from MLE). Dim dashed lines: fits obtained with parameter estimates given in the original publications. Frequencies for each clone size (basal cell number) are shown in different colors. See Supplementary Data 4 for goodness-of-fit statistics.

