Figure 1.
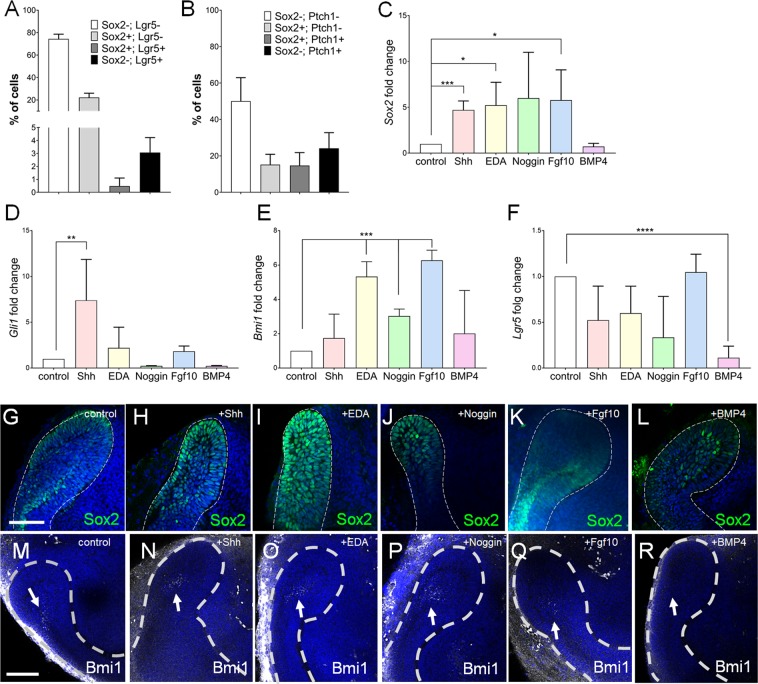
Regulation of Sox2-GFP+ cells by different signaling molecules. Quantification of flow cytometry analysis of Sox2-GFP and Lgr5 (A), and Sox2-GFP and Ptch1 expression (B) in the EpCAM+ epithelial compartment of the incisor. (C–F) RT-qPCR analysis of stem cell markers Sox2 (C), Gli1 (D), Bmi1 (E) and Lgr5 (F) in explants cultured 24 h with indicated proteins. N ≥ 3, *p value <0.03, **p value <0.01, ***p value <0.001, ****p value <0.0001 were determined by Student’s tTest or one-way ANOVA (Gli1). Immunostaining for Sox2 (G–L) and Bmi1 (M–R) in organ cultures of proximal ends of the P2 incisors cultured for 48 h with Shh (H,N), EDA (I,O), Noggin (J,P), Fgf10 (K,Q), and BMP4 (L,R). Nuclei were stained with DAPI. White dashed line outlines the cervical loop. Scale bar 100 μm.

