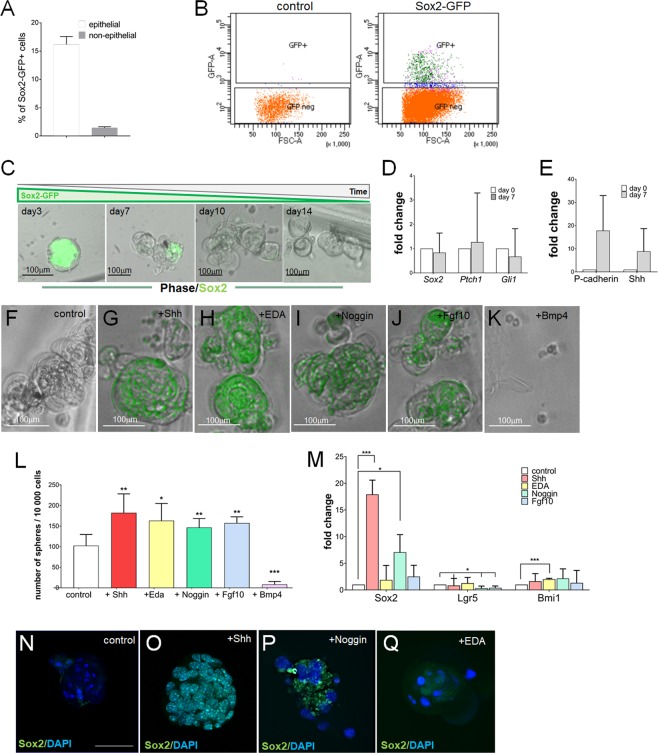
Figure 3.
Isolation and in vitro culture of Sox2-GFP+ stem cells. (A) Quantification of flow cytometry analysis of Sox2-GFP expression in the cells obtained from proximal ends of the incisor. (B) Strategy for FACS sorting of LaCL cells derived from Sox2-GFP+ animals. (C) Temporal analysis of Sox2-GFP expression in control cultures. (D) RT-qPCR analysis of stem cell markers Sox2, Ptch1 and Gli1 at day 7 of culture. (E) RT-qPCR analysis of TAC markers P-cadherin and Shh at day 7 of culture. (F–K) Analysis of Sox2-GFP expression in spheres after 14 days of culture. (L) Sphere formation capacity (number of spheres formed per 10 000 cells). N ≥ 4, *p value < 0.025, **p value < 0.01 and ***p value < 0.001 were determined by Mann-Whitney test. (M) RT-qPCR analysis of stem cell markers Sox2, Lgr5 and Bmi1 in 14 days old cultures. N = 3, *p value < 0.05 and ***p value < 0.001 were determined by Student’s tTest. (N–Q) Immunostaining for Sox2 protein in 14 days old spheres. Nuclei are stained with DAPI. Scale bar 100 μm.

