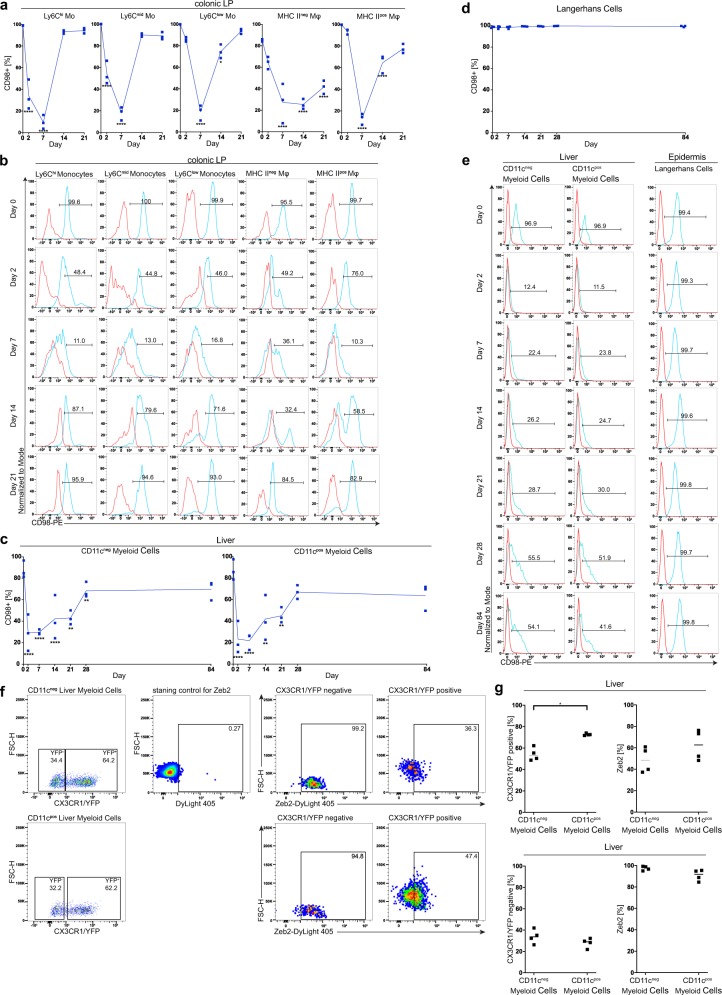
Fig. 2. Tamoxifen injection into CD98hcΔCX3CR1 animals leads to the excision of CD98hc in monocytes and macrophages.
Following intraperitoneal tamoxifen injection, monocytes, and macrophages were isolated from the colonic lamina propria (cLP) of CD98hcΔCX3CR1 animals at indicated time points and analyzed for CD98hc expression by flow cytometry. a Percentage of CD98hc+ monocytes and macrophages (n = 3). b Histogram plots showing CD98hc staining intensity in cLP monocytes and macrophages. c Mean (±SD) percentage of CD98hc+ CD11cneg, and CD11cpos liver myeloid cells and (d) Langerhans cells (n = 3). e Histogram plots of CD11cneg and CD11cpos liver myeloid cells and Langerhans cells isolated from liver and epidermis, respectively. Red histograms display FMO controls, blue histograms CD98hc+ cells; Numbers in histograms show the percentage of CD98hc+ cells (b, e). The data are shown as the mean (± SD), and the results were analyzed by two-way ANOVA followed by Sidak’s correction; *p < 0.05, **p < 0.01, ***p < 0.001, ****p < 0.0001 (a–d). f After gating on CX3CR1/YFP+ or CX3CR1/YFP− CD11c+ or CD11c− liver myeloid cells, Zeb2 expression by CD11c+ or CD11c− liver myeloid cells were analyzed. Numbers in dot plots indicate the percentage of positive cells. g Percentage of CX3CR1/YFP+ or CX3CR1/YFP−, and percentage of Zeb2+ CD11c+ or CD11c− liver myeloid cells. Each dot represents one animal; the mean is indicated. The data were analyzed by Mann–Whitney U test; *p < 0.05. Experiments were performed once with three biological replicates for CD98hc silencing kinetics, and once with four biological replicates for Zeb2 expression.

