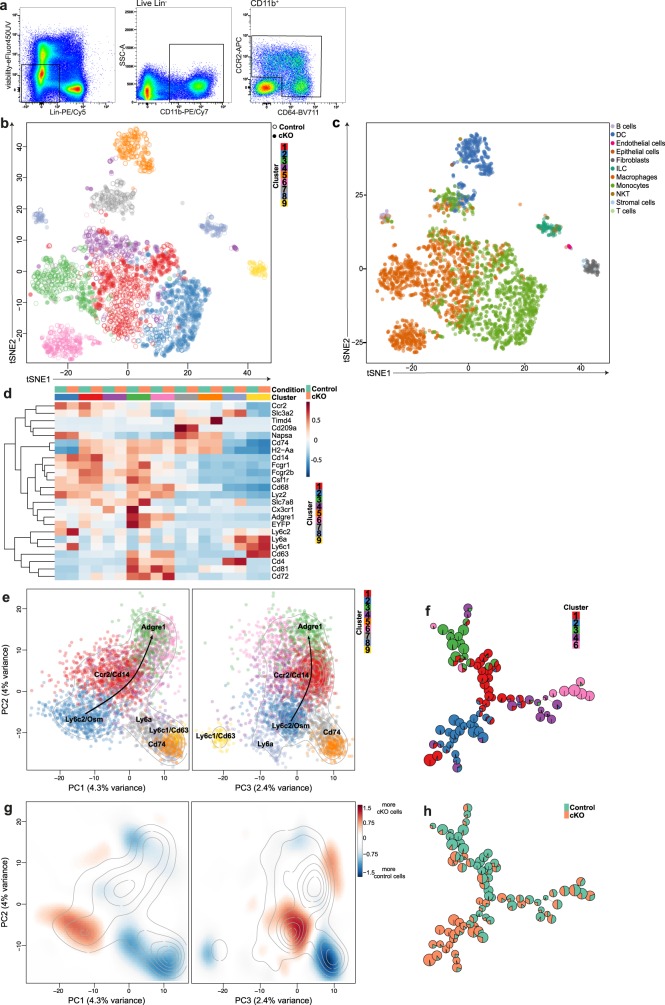
Fig. 5. Single-cell RNA sequencing suggests a developmental trajectory from monocytes to macrophages in the colonic lamina propria.
After sorting of viable CCR2+CD64−/CCR2+CD64+ and CCR2−CD64+ cells from CD98hcΔCX3CR1 mice treated with corn oil or tamoxifen, sorted monocytes, and macrophages were further analyzed by single-cell RNA sequencing (scRNA-seq). scRNA-seq was performed in quadruples. a Gating strategy for the isolation of CCR2+CD64−/CCR2+CD64+ and CCR2−CD64+ colonic monocytes and macrophages for scRNA-seq analysis. b t-SNE analysis depicts the distribution of the nine different clusters and indicates their relationship in corn oil (vehicle control) or tamoxifen (cKO) treated CD98hcΔCX3CR1 mice. c t-SNE visualization shows the annotation of the scRNA-seq data set by using SingleR comparing our data set to the immunological genome project (ImmGen) reference data set. d Genes that are characteristic for monocytes and macrophages were depicted and presented as a heatmap. The heatmap of top cluster-specific genes consists of the union of the top ten genes from each between-clusters pairwise comparison. e Principal component analysis of single-cells, based on the 500 most variable genes across all cells. The colors represent cells from the different clusters. Contour lines indicate the density of the cells in the principal component analysis space. f FlowSOM analysis after exclusion of the contaminant clusters 5, 7, 8, and 9. g The color of the differential 2D density plot represents the log2 ratio of 2D densities of cKO cells over control cells. h Pie charts within the FlowSOM tree indicate the relative enrichment of cKO cells over control cells. The experiment was performed once (scRNA-seq) with four biological replicates in each group.

