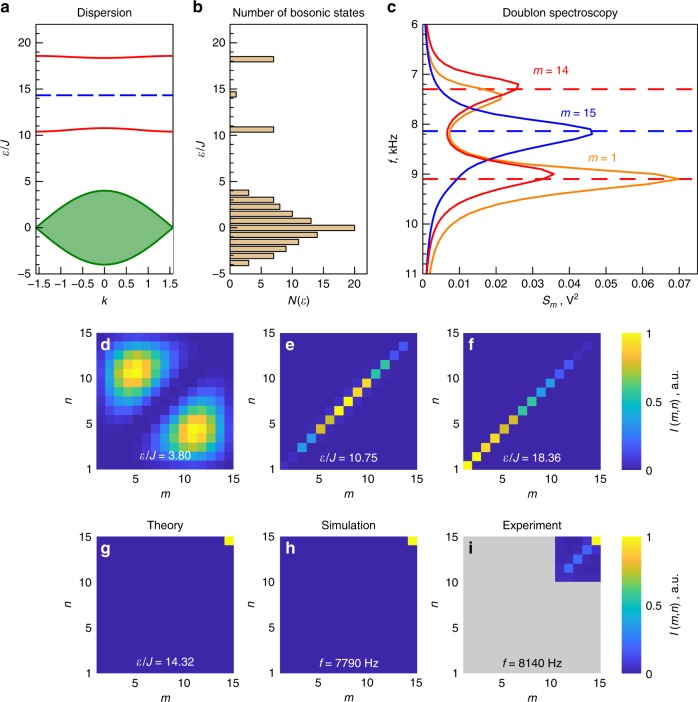
Fig. 2. Theoretical studies and experimental emulation of two-photon excitations.
a Dispersion of two-photon eigenmodes calculated from the tight-binding model. Two red solid curves correspond to doublons, horizontal dashed line between them indicates the energy of the doublon edge state, and the shaded area at the bottom shows the continuum of two-photon scattering states. b Number of bosonic states in the tight-binding system of size 15 × 15 sites. c Doublon spectroscopy with quantity Sm(f) [cf. Eq. (10)] determined from experimental data and plotted as a function of driving frequency. The feeding points (1, 1), (14, 14), and (15, 15) are labeled with corresponding values of m = 1, 14, 15 and are shown by orange, red, and blue solid lines, respectively. Characteristic peaks in the spectrum correspond to doublon modes. d–g Two-photon probability distributions ∣βmn∣2 for the eigenmodes of 15 × 15 lattice described by the Hamiltonian Eq. (1) in the absence of disorder. Panels d, e, f and g correspond to the scattering states, lower and upper bulk doublon bands and doublon edge state, respectively. h Eigenmode reconstruction for a circuit of 15 × 15 nodes simulated taking into account the disorder in the element values as well as Ohmic losses (see “Methods” section for details). i Experimental implementation of the eigenmode reconstruction for the doublon edge state.

