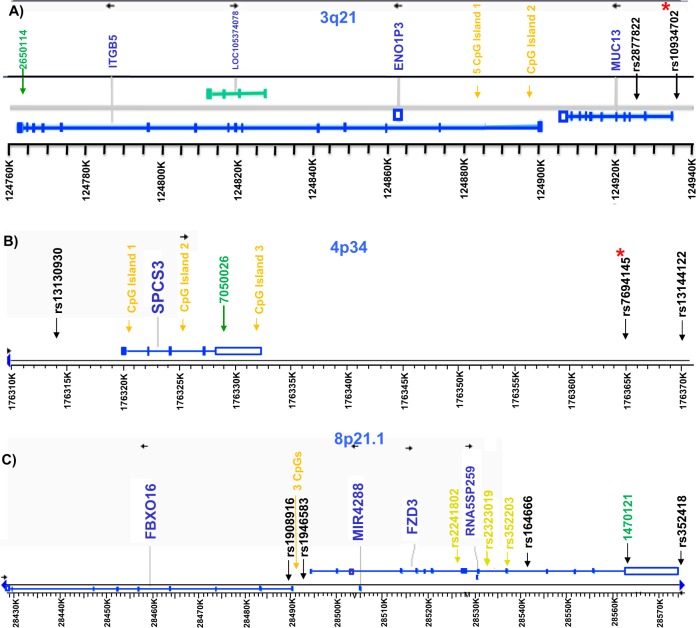
Fig. 1.
Genomic structure of the genes highlighted in the results section. a ITGB5, b SPCS3, and c FZD3. CpG islands for which methylation was measured are indicated in dark yellow. Single nucleotide polymorphisms (SNPs) are indicated by their reference sequence number. a, b SNPs marked with an asterisk create a CpG site; c SNPs marked with an asterisk showed association with SZ in a Chinese sample [37] (Color figure online)

