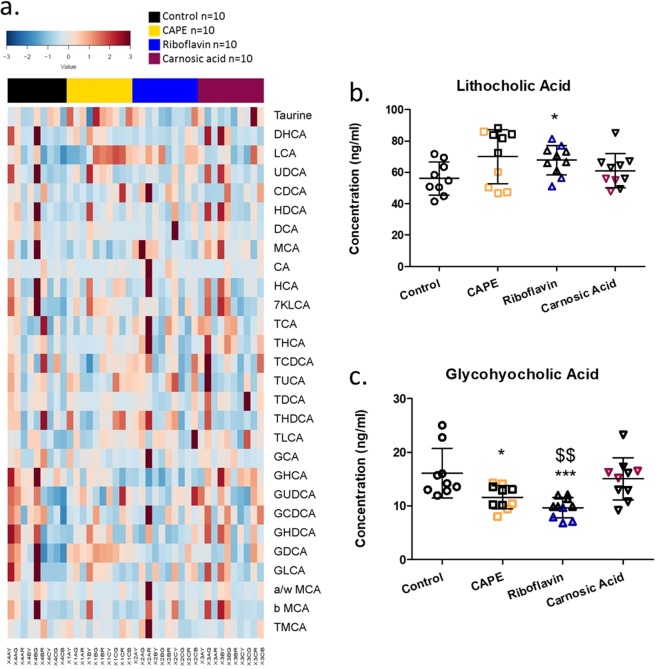
Figure 6.
Assessment of the effects of BSH inhibitors on circulating bile acid signatures (a) heatplot showing relative representation of individual bile acid moieties for individual animals following their respective treatments. (b) lithocholic acid and (c) glycohyocholic acid levels are significantly altered in plasma samples following either CAPE or riboflavin treatments, similar trends are evident with carnosic acid. Data is represented as mean ± SD. Coloured subjects represent responder (RS) animals with black subjects classified as non-responders (NRS).

