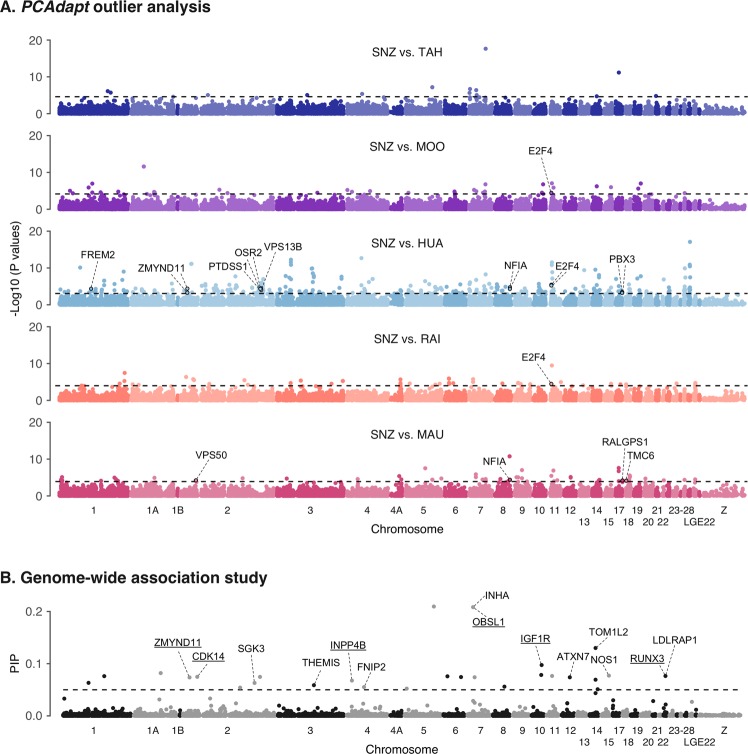
Fig. 5. Signatures of selection in the French Polynesian silvereye population.
a Manhattan plot of negative log10 (P values) estimated using PCAdapt. Points above the dashed line indicate outlier SNPs identified using FDR = 0.01. Genes containing outlier SNPs or within 10,000 bp of outlier SNPs and thought to be associated with morphological divergence are labelled. The distance of outlier SNPs from candidate genes is reported in Table S3. b Manhattan plot of BSLMM analysis of PC1 (body/bill size) scores. The dashed line indicates the threshold of posterior inclusion probability (PIP) = 0.5. Genes within 10,000 bp of SNPs with PIP ≥ 0.5 are labelled. Genes previously associated with morphological variation in birds, or where a strong case for inclusion as candidates can be made, are underlined. Chromosomes are numbered according to the T. guttata nomenclature. SNZ South Island, New Zealand; TAH Tahiti; MOO Mo’orea; HUA Huahine; RAI Raiatea; MAU Maupiti.

